Venture
Exploring Discounted Cash Flow Modelling with Ethereum
Date of Publication
September 2024
Author
Charlie Kellaway
Reading Time
12 minutes

Introduction
Blockchain technology, a ledger of transactions distributed over a network of computers, introduced the concept of cryptoassets as far back as 2010 [1]. Financial markets have since flooded with new, digital currencies and their prolific rise teases a paradigm shift in trade mechanics. Boom-and-bust cycles have caught media attention: Bitcoin, the original cryptoasset and most valuable by market capitalisation, has posted average annual returns of 60.2% since 2014 for a total return of 11,000% [2]. However, in 2018 and 2022, it dropped 73.4% and 64.2%, respectively. Similarly, the cumulative market capitalisation of all cryptoassets jumped from US$786bn in 2018 to peak at US$3.04tn in November 2021 but subsequently declined 68% within a year. It currently holds US$2.19tn [3].
Such prolific growth intertwined with severe downside demands attention. Careful analysis by institutional and retail investors alike can assess the value and diversification offered when incorporating cryptoassets into a portfolio. A classic way to achieve this for traditional assets involves fundamental valuation.
Fundamental analysis examines a company’s financial statements and economic outlook to determine its intrinsic value. The intrinsic value of cryptoassets is less clear, noting a general lack of financial statements or widely agreed economic indicators, but has been related to the utility of underlying smart contract technology [4]. The more efficiently a blockchain can execute smart contracts, the more value it provides users and investors.
In the absence of economic indicators, this argument is worth exploring. Smart contracts are code deployed in a blockchain environment, executed in a distributed, automated manner by validators of the underlying blockchain when conditions of the code are met [5]. Automated execution supports the interoperability and scalability of blockchains. Smart contract platforms, therefore, are blockchains that change state when these contracts execute [6]. Also termed Layer-1 solutions, they are the foundation of decentralised ecosystems, providing productive environments in which developers can build decentralised applications (dApps) for user activities. In theory, the more economically valuable the development, the more interoperability afforded and the greater the scale of a Layer-1 network, the more intrinsic value it holds.
Layer-1s are not directly comparable with traditional asset classes since they diverge in how they generate revenue. Many, in fact, fail to generate any revenue at all in their current state. However, they can create economic value for users, inviting experimentation with valuation methodologies. In addition to intrinsic models, relative valuation logically compares the fundamentals of competing Layer-1 blockchains to assess their worth.
As this nascent asset class evolves, it stands to reason that experimentation can enhance collective understanding of how smart contract platforms provide value. This report contributes by applying intrinsic and relative methodologies to the most popular smart contract platform, Ethereum.
Ethereum
Ethereum, launched in 2015, is the longest serving smart contract platform. It has the largest market capitalisation of smart contract platforms (US$282.94bn) and is second in size only to Bitcoin (US$1.19tn) [7]. Ethereum can be likened to a shopping centre: an environment in which shops, eateries and other services operate. Ethereum determines the structure and rules that businesses adhere to and maintains a ledger of all economic events that occur. Services are deployed as dApps and span decentralised finance (DeFi), gaming, art creation and more.
Smart contracts execute functions when conditions of trade meet Ethereum’s logic. Therefore, trade occurs in a peer-to-peer manner, without users needing to trust counterparties. When each party to a transaction meets preset requirements, the contract exchanges value between the two.
Users pay fees when they interact with decentralised businesses, which increase or decrease relative to demand for network resource. Additionally, validators – computers that run Ethereum – receive rewards and a portion of the fees. Validators verify transactions; timestamping and bundling them into archival blocks with other transactions until the block reaches maximum size. Once verified, smart contracts enact their coded actions [8].
Fees are paid in Ethereum’s native cryptoasset token – ether (ETH) – and users cannot act without it. When lots of work must be done, workload increases and the network faces congestion, increasing fee payments. For the privilege of performing work, validators post ETH as collateral against their honesty. So, ETH is used to pay validators and validators sell ETH to work for Ethereum.
Ethereum also auctions off the right to order transactions in each block, since there is value in ordering transactions. A high-frequency trader, for example, relies on speed and the final execution of trades to secure their competitive position. Equally, an art dealer will want to secure a piece ahead of other buyers. So Ethereum’s core business comprises of selling space in each block (block space) and selling the right of others to order it [9].
Several studies have pitched intrinsic valuation methodologies for Ethereum based on fees. Conceptually, if Ethereum supports applications, protocols and marketplaces, fees measure the value users perceive the ecosystem to provide, since they will pay based on utility. This allows us to project Ethereum’s cash flow.
In addition, we can perform relative analysis given the fees and total value locked (TVL) on Ethereum’s protocol. TVL represents the total value of assets staked by users in a certain blockchain project or dApp. The higher the TVL, the more secure and trustworthy a project is deemed to be, since staked value can be used for economic activities (such as lending) and to attract more users [10].
Both fees and TVL have been positively correlated with blockchain value [11]. Other platforms, such as Solana, Cardano and Avalanche, have emerged to compete with Ethereum and are comparable through these on-chain metrics [12].
Discounted Cash Flow Modelling for Ethereum
Intrinsic valuation is based on analysis of investment fundamentals according to three possible approaches [13]. One of these, discounted cash flow (DCF) modelling, views the intrinsic value of a security as the present value of its expected future cash flows. We apply DCF to Ethereum which has calculatable cash flows through its business model [14].
- All users pay fees in ETH when interacting with applications on Ethereum.
- For each fee, a portion of ETH is burned and removed from circulation. Fee burning, like a share buyback, reduces circulating supply and increases long-term value for current ETH holders, representing revenues.
- The portion of the fee that is not burned is paid to validators and Ethereum also issues new ETH to validators for their work (like stock-based compensation). This dilutes existing ETH holders, constituting an expense.
- The difference between the daily value of the burned ETH and newly issued ETH represents the daily earnings for existing ETH holders.
These items allow us to calculate Ethereum’s current annualised cash flows, the percentage of cash flows paid out to holders and an expected growth rate for cash flows in future [15]. With this, we can perform DCF analysis.
| Income Statement | Q3-24 | Q2-24 | Q1-24 | Q4-23 | Q3-23 | Q2-23 | Q1-23 |
|---|---|---|---|---|---|---|---|
| Fees | $181.05m | $492.83m | $1.17b | $654.78m | $445.46m | $847.05m | $458.94m |
| Revenue | $102.96m | $368.61m | $1.03b | $560.82m | $354.90m | $713.47m | $385.85m |
| Expenses | $571.83m | $792.98m | $665.89m | $437.31m | $355.86m | $332.09m | $266.59m |
| Earnings | ($468.87m) | ($424.37m) | $364.11m | $123.51m | ($960k) | $381.38m | $119.26m |
| % Change q/o/q | -11% | -215% | 199% | 12,955% | -100% | 220% | 5,320% |
Date: 15 September 2024
Source: Token Terminal
The first variable to consider is growth, to forecast cash flows out five years to 2029. We must estimate a starting value for 2024 and consider the past seven quarters to do so (Table 1). Negative earnings in the two most recent quarters would have an outsized effect on DCF: instead, we apply an optimistic long-term view and uplift 2023 by 111%, consistent with growth year-on-year growth from 2022. We begin with US$691.74m.
To extend to 2029, previous models guide our assumptions [16]. Soni and Preece project an initial growth rate of 56.99% per annum, smoothing by 10% year-on-year to 16.99%. Allis begins with 50%. We calculate a Compound Quarterly Growth Rate (CQGR) between Q1-23 and Q1-24 of 32.19% and average all three rates for 46.39%. We apply this in year one and reduce 8% each year on the assumption that blockchain will mature.
Using Gordon Growth Model (GGM), a DCF that assumes a constant growth rate for cash flows in perpetuity, we must solve for the present value of perpetual growth [17]. Previous models suggest between 3-7%. Our base case uses 7%, but we provide an additional, more optimistic view with 10%. This has a material effect on the value of ETH, providing a range for ETH and highlighting the impact of subjective assumptions.
DCF requires a discount rate to determine the present value of future earnings. Previous models guide us: Soni and Preece apply 12.24%, Cumberland 10% and Allis 12%. Our base case uses 11%, however, we again highlight the range of possibilities with rates of 10% and 12%.
Note that discount rate is subjective. Startup investments typtically use 30% or greater and some analysts may deem this more appropriate [18].
We sum all annual present values and the terminal value (capturing perpetual cash flow) and divide by the number of circulating tokens (120m) to project ETH’s current value.

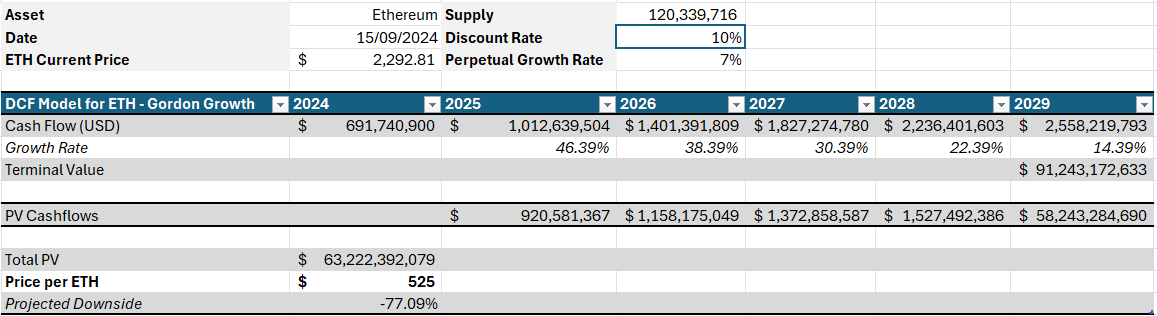


A broad valuation appears between U$310-1,441/ETH, marking a 37-87% drop on market price. Naturally, the most optimistic growth rate provides the most valuable projection. Three of four models suggest downside of over 77%.
It is important to note that, though DCF is a valuable exercise, forecasting is challenging and subjective. Changes in the discount rate, growth rate or time horizon have a significant impact on present valuation, and each component is at an analyst’s discretion. Assumptions may be biased by the investor’s own industry perspective or tilted towards outsized growth in a recent period.
Our assumptions are largely optimistic, firstly, because improved scaling solutions are likely. With most technologies, this leads to a material drop in operating costs, so we expect Ethereum’s expenses to decrease over time. Secondly, blockchain earnings are dependent on ecosystem users. Transaction numbers have declined over the last two years as the industry has contended with issues of trust and security [19]. Assuming regulation and innovation will resolve this, we expect user numbers and earnings to rise.
Yet we find Ethereum overvalued. The fundamental economics of Ethereum remain valid, so assessment demands further investigation. For this, relative valuation is appropriate.
Relative Valuation Modelling for Ethereum
Given fees, revenues and TVL, we can further our analysis by comparing relative valuation ratios. Ethereum has a substantially larger market capitalisation than most. However, it is challenged by several smaller Layer-1 competitors, namely, Avalanche, BNB Chain and Solana, and we can use their fundamentals for analysis.
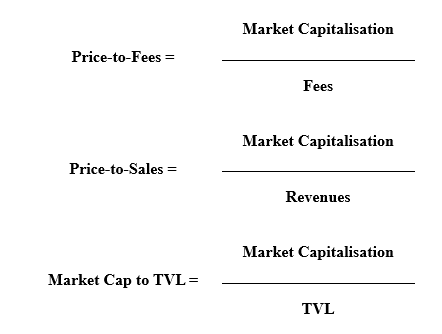
A price-to-fees ratio (P/F) indicates how the market values fees generated by a smart contract platform and can be likened to price-to-book in traditional finance. The same methodology can be applied solely to revenues (P/S). TVL represents the value of funds currently staked on all dApps on a smart contract platform and can also be compared against the total market capitalisation (price) of the blockchain.
| Platform / Token | Price | Circulating Supply | Market Cap | Annualised Fees | Annualised Revenues | TVL |
|---|---|---|---|---|---|---|
| Avalanche / AVAX | $23.95 | 406m | $9.72b | $6.83m | $6.83m | $927.13m |
| BNB Chain / BNB | $545.36 | 146m | $79.59b | $136.51m | $14.40m | $4.32b |
| Ethereum / ETH | $2,293 | 120m | $275.92b | $490.50m | $225.51m | $43.81b |
| Solana / SOL | $131.01 | 468m | $61.34b | $235.59m | $117.79m | $4.69b |
Date: 15 September 2024
Source: Token Terminal
| Platform | P/F | P/S | Market Cap/TVL |
|---|---|---|---|
| Avalanche | 1,423x | 1,423x | 10.5x |
| BNB Chain | 583x | 5,527x | 18.4x |
| Ethereum | 563x | 1,224x | 6.3x |
| Solana | 260x | 521x | 13.1x |
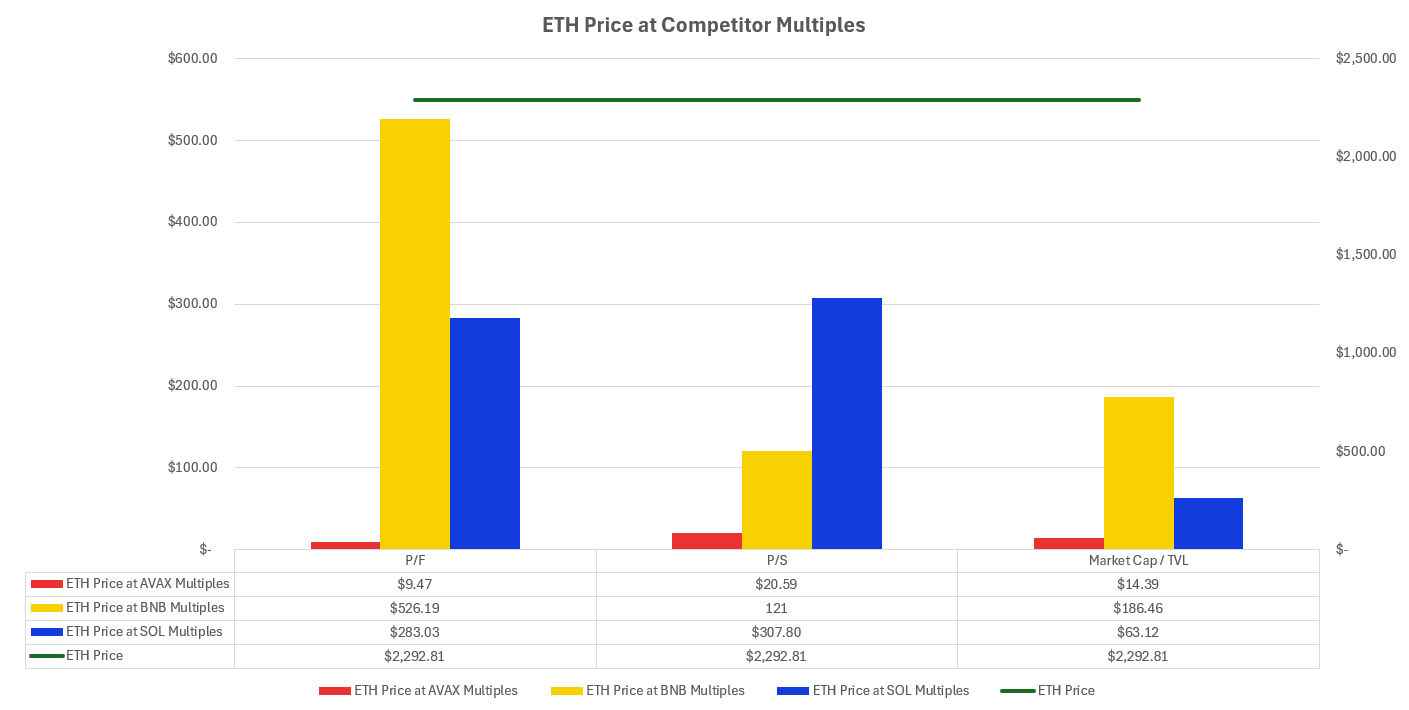
Ethereum’s market capitalisation is 563x greater than the fees it generates and 1,224x greater than its revenues. This is not out of touch with the cohort – ratios for Avalanche and BNB Chain are higher – but might indicate overvaluation. Consider that Ethereum’s market capitalisation is 4.5x greater than Solana’s, yet it generates just 2x Solana’s fees and 1.9x revenues. This suggests Ethereum’s fees and revenues are given more weight than Solana’s and the two blockchains are priced inconsistently.
We conclude that price is driven by another factor: TVL. Ethereum’s market capitalisation is just 6.3x greater than the value locked on its platform – Avalanche is nearest at 10.5x. In dollar terms, however, US$43.81bn is locked on Ethereum, 9.34x greater than Solana (US$4.69bn) and 47x greater than Avalanche (US$927m). The divergence in market capitalisation is high and TVL appears to contribute heavily to valuation of blockchains.
Challenges
Fundamental analysis of Ethereum uncovers challenges in cryptoasset valuation. Factors that DCF models consider critical present Ethereum as heavily overpriced. However, relative valuation suggests other factors are important to crypto investors, namely, TVL. And herein lies a problem.
Established valuation techniques dating as far back as 1934 are still applicable for equities, though they were also published years after equities first formed as an asset class [16]. They are rooted in years of fundamental research. In contrast, cryptoassets have only been around since 2009 (bitcoin) and many are younger than 5 years. Current valuation models must be considered limited in this context.
Given their infancy, historic data is lacking to build a more comprehensive framework. DCF models are sensitive to analyst assumptions, so there is greater reliance on historic data to certify assumptions than with other models. Cryptoassets are also developing at pace, with regulation and technological innovation continuing to change the landscape. It may be some time before the proper range of assumptions is found. But a method to incorporate TVL appears pressing.
This is reflected in institutional attitudes to cryptoassets. It is widely agreed that the ecosystem is not yet mature: global events, such as monetary policy shifts, have exposed weakness in crypto infrastructure to the detriment of millions of investors and users [17]. This also shows that crypto is integrated with wider macroeconomic events, and institutions need legal and regulatory clarity before seriously considering cryptoassets for portfolios [18].
To reach institutional quality, regulation must clarify several complex areas. Proper custody of client assets is vital, as are KYC (know-your-client), AML (anti-money-laundering) and financial crime structures. Though certain countries have made progress, globally there is little alignment, meaning different jurisdictions can impose different regulations.
Hedge funds and venture firms will search the space, as will some institutions (though, likely with minimal exposure). Valuation principles can improve with time and exploration. The challenge for blockchain is penetrating mainstream user bases despite an absence of coherent understanding of crypto’s value proposition. Are the business fundamentals of blockchain sound enough to attract current use and investment?
Layer-1s need their own native cryptoassets to enable contract execution. Additionally, validators are paid in, and users can vote with, native assets. Without these, platforms would be difficult to maintain. However, the question circles back to the argument that cryptoasset value is related to the utility of underlying smart contract technology. Users will only pay validators or vote in blockchains where they value the activities provided. Therefore, investment in technological innovation may be more rational than in tokens themselves.
Valuation is challenging and, whilst collective understanding of cryptoassets is low, investors must separate technology from the specific digital asset it supports. The most logical basis for value resides in how users use blockchains: what for and how frequently. Usage – utility – indicates the longevity of economic contributions.
Relevance
Digitalisation of world economies is underway and cryptoassets offer a way to capture value during this shift. They are volatile, but also provide value and early adopters can gain as the technology develops. A given token may not have value today but may show potential to disrupt and provide utility in future – a feature perhaps aligning crypto with venture investments.
Current volatility demands attention on underlying economics. We associate the fundamental value of cryptoassets to the utility of primary blockchain technologies, as this determines how and why people use them. This explains why TVL appears to be prioritised: it affords liquidity for economic uses. Accordingly, calculating the value of a native cryptoasset is to estimate the future utility of its blockchain, rather than assessing present economic output. DCF modelling can support this, naturally representing the present value of future cash flows, but models must adapt to blockchain fundamentals.
Ethereum is a suitable case study, since its business model generates cash flow. Ethereum promises peer-to-peer economic opportunities and efficiencies across trade and supply chains – clear utility that would increase with increasing users – and, importantly, offers cash flows to users [23]. The protocol uses revenues to reduce token supply and pay staking rewards, generating earnings for token holders. This makes a DCF feasible.
Though valuation methodologies are limited and always at the discretion of the researcher, they provide insight into the mechanics of an asset under scrutiny. In a class as volatile as crypto, using DCF to complement analysis provides a basis for more educated investment decisions. In this example, outputs required relative valuation for further clarity. Overall, the two can support deeper understanding of factors driving cryptoasset price formation.
Concluding that cryptoasset fundamentals are driven by users, an investment strategy should be to accumulate tokens poised to appreciate because they grant access to a blockchain promising utility.
[1] IBM. (2023). What is blockchain? Available at: IBM (Accessed: 14 August 2024).
[2] Historical performance of the Bitcoin index. Available at: https://curvo.eu/backtest/en/market-index/bitcoin?currency=eur (Accessed: 14 August 2024).
[3] CoinGecko. Global Cryptocurrency Market Cap Charts. Available at: https://www.coingecko.com/en/global-charts (Accessed: 13 August 2024).
[4] Deane, S., & Fines, O. Cryptoassets: Beyond the Hype. Available at: CFA Institute (Accessed: 13 August 2024).
[5] Szabo, N. (1997). The idea of smart contracts. Nick Szabo’s Papers and Concise Tutorials, 6.
[6] De Filippi, P., Wray, C., & Sileno, G. (2020). Smart contracts. Internet Policy Review, ISSN 2197-6775, 10(2), 1-9.
[7] CoinMarketCap. Today’s Cryptocurrency Prices by Market Cap. Available at: https://coinmarketcap.com/ (Accessed: 14 August 2024).
[8] Buterin, V. (2013). A Next Generation Smart Contract & Decentralized Application Platform. Available at: Ethereum.org (Accessed: 31 March 2024).
[9] Sigel, M. (2023). A Potential Valuation Methodology for Ethereum. Available at: VanEck (Accessed: 31 March 2024).
[10] Ether Crunch. (2024). What is Total Value Locked (TVL)? Available at: Medium (Accessed: 14 August 2024).
[11] Metelski, D., & Sobieraj, J. (2022). Decentralized Finance (DeFi Projects: A Study of Key Performance Indicators in Terms of DeFi Protocol’s Valuations. IJFS, 10 (4), 1-23.
[12] Soni, U., & Preece, R. (2023). Valuation of Cryptoassets: A Guide for Investment Professionals. Available at: CFA Institute (Accessed: 31 March 2024).
[13] CFA Institute. (2022). Guide to 2022 CFA® Program Curriculum Changes. Available at: CFA Institute (Accessed: 15 August 2024).
[15] Allis, R. (2021). ETH’s Intrinsic Value Comes from Cash Flows. Available at: Coinstack (Accessed: 15 August 2024).
[16] Cumberland. (2022). Valuing Ethereum into the Merge. Available at: Cumberland (Accessed: 22 September 2024).
[17] Hayes, A. (2024). Gordon Growth Model (GGM): Definition, Example, and Formula. Available at: Investopedia (Accessed: 22 September 2024).
[18] Aggarwal, A., & Bahl, N. (2021). Start-ups and Early Stage Companies. Available at: KPMG (Accessed: 22 September 2024).
[19] Khatwani, S. (2024). Blockchain Users Statistics in 2024. Available at: Social Capital Markets (Accessed: 22 September 2024).
[20] Dodd, D., & Graham, B. (1934). Security Analysis: The Classic 1934 Edition. York, PA: The Maple Press Co.
[21] Griffith, E. (2022). Why the Crypto Collapse Matters. Available at: The New York Times (Accessed: 15 September 2024).
[22] Sherpa, P. (2023). IMF Executive Board Discusses Elements of Effective Policies for Crypto Assets. Available at: International Monetary Fund (Accessed: 15 September 2024).
[23] Allis, R. (2021). The Investment Case for Ethereum. Available at: Coinstack (Accessed: 08 September 2024).
