Asset Management dApps in Decentralised Finance
A NOTE ON DECENTRALISED ASSET MANAGEMENT APPLICATIONS
Decentralised applications for asset management provide settlement, portfolio rebalancing and liquidation. dApps deploy smart contracts so users can optimise allocations by automating strategy execution, whilst also ensuring transparency, security and efficiency in management. Tools such as decentralised exchanges (DEXs), liquidity pools and yield farming offer users control over their assets, which can take the form of non-fungible tokens (NFTs), cryptoassets, stablecoins and tokenised instruments.
As DeFi evolves, asset management projects will empower users to derive value from their digital assets. We must reason why an investor should prefer one project over another and provide fundamental and comparable valuation analysis for several leading dApps in the space. See calculation terminology here.

FINANCIAL DATA
| Platform | Native Token | Price | Circulating Supply | Market Cap |
|---|---|---|---|---|
| Cryptex Finance | CTX | $2.61 | 6,628,421 | $17,300,179 |
| Enzyme Finance | MLN | $19.35 | 2,665,961 | $51,586,345 |
| Index Coop | INDEX | $3.35 | 6,730,000 | $22,545,500 |
| Ribbon Finance | RBN | $0.55 | 149,794,061 | $81,757,598 |
Source: CoinMarketCap
Date: 19 July 2024
| Platform | Treasury | Annualised Revenues | Annualised Fees | Total Value Locked |
|---|---|---|---|---|
| Cryptex Finance | $10,260,000 | $2,950 | $2,950 | $571,580 |
| Enzyme Finance | – | – | – | $161,160,000 |
| Index Coop | $14,500,000 | $405,500 | $405,500 | $69,620,000 |
| Ribbon Finance | $166,380,000 | $193,890 | $1,140,000 | $12,840,000 |
Source: Token Terminal
Date: 19 July 2024
| Platform | Market Cap to Net Assets | Price to Sales | Price to Fees | Market Cap to TVL |
|---|---|---|---|---|
| Cryptex Finance | 1.7x | 5,864x | 5,864x | 30.3x |
| Enzyme Finance | – | – | – | 0.3x |
| Index Coop | 1.6x | 55.6x | 55.6x | 0.3x |
| Ribbon Finance | 0.5x | 422x | 72x | 6.4x |
Date: 19 July 2024
| Token | Revenue Q1-23 ($) | Revenue Q2-24 ($) | CQGR | Expenses Q1-23 ($) | Expenses Q2-24 ($) | CQGR |
|---|---|---|---|---|---|---|
| CTX | 1,080 | 992,810 | 211.8% | 42,690 | 198,030 | 29.1% |
| MLN | – | – | – | – | – | – |
| INDEX | 192,690 | 117,330 | -7.9% | 236 | 1,900 | 41.5% |
| RBN | 299,670 | 59,810 | -23.6% | 727,390 | 397,680 | -9.6% |
Date: 19 July 2024
Relative Valuation
Cryptex Finance
Cryptex Finance uses Ethereum smart contracts and Pyth oracles to provide secure, decentralised trading for users on the Arbitrum network. Cryptex is a Decentralised Autonomous Organisation (DAO) governed by holders of CTX tokens, who can vote on proposals, upgrades and treasury management for governance. It enables Long/Shorting of synthetic assets, 100x leverage and passively liquidity provision to support market making in exchange for rewards.
Priced $2.61 per token with 6.6mm in circulation, Cryptex has the lowest market capitalisation of protocols analysed. It has a low market cap/net assets ratio of 1.7, explained by $10.26mm in its treasury, which is impressive in the context of its other fundamentals. Market cap/net assets can be likened to price-to-book, for which a ratio at or below 1.0 is considered healthy. Though 1.7 exceeds this, Cryptex’s multiple is lowest in the cohort and far lower than lending protocols.
However, Cryptex Finance has extremely weak fees, annualised at $2,950, all recognised as revenues. This translates to excessively high P/S and P/F multiples of 5,864x, suggesting CTX is overvalued given what is retained to keep the lights on. Cryptex also has a market cap/TVL ratio of 30.3, owing to just $571,580 locked on the protocol. Compared to its peers, which lock between $12mm-$161mm, Cryptex is weak, suggesting users do not find it useful. Both TVL and fees have been found positively correlated with value in DeFi protocols. On this assessment, CTX appears heavily overvalued.
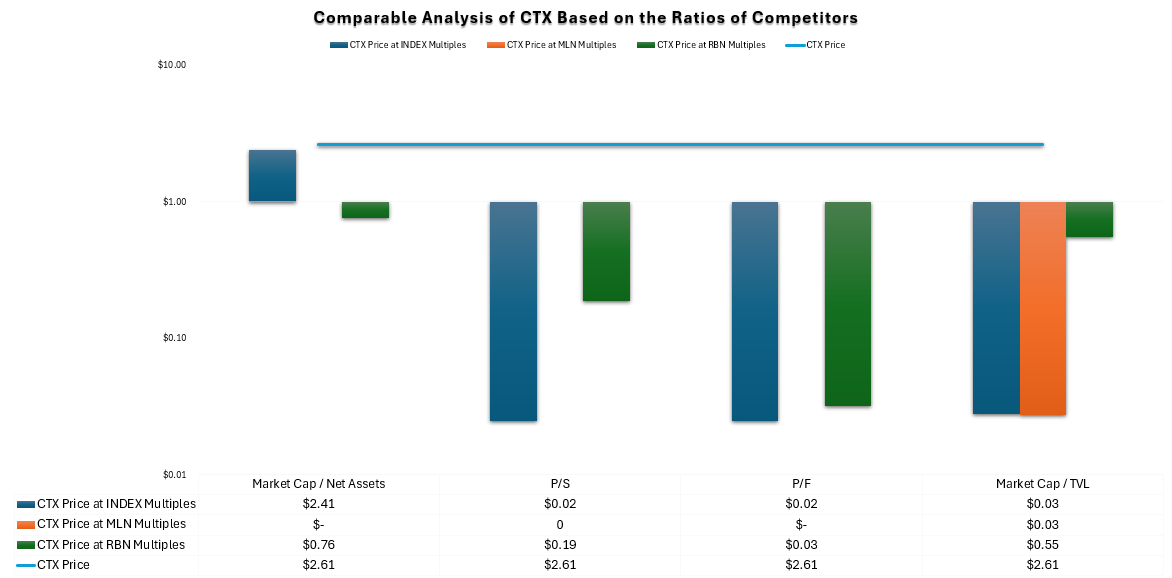
Comparable analysis supports. We have used only the ratios of Index Finance and Ribbon Finance, since key fundamentals for Enzyme Finance could not be sourced.
- CTX appears fairly valued based on market cap/net assets ratios of INDEX and RBN.
- Considering fees, revenues and TVL, CTX is heavily overvalued.
The simplest comparison is with Index Coop which, with a market cap of $22.55mm and treasury of $14.50mm, appears similar in size. Indeed, if Index Coop had the circulating supply of Cryptex Finance, price per INDEX would keep steady, rising marginally to $3.40. And Index Coop has a market cap/net assets ratio of 1.6, closely aligned with Cryptex, explaining why CTX looks fairly valued on this multiple.
However, all other ratios show CTX is overvalued and suggest that the market has not adequately priced revenues, fees or TVL into its price. If the protocols had an equivalent circulating supply, CTX is $0.74 short of INDEX per token, yet Cryptex generates just 0.73% of the fees and revenues of Index Coop and has $69mm less locked on its network.
We conclude that a reasonable price would almost certainly take CTX under $1, with a possible downside of 96% to go as low as $0.02.
Enzyme Finance
Operating on both Ethereum and Polygon, Enzyme Finance (formerly Melon Protocol) enables people to create tailored investment structures known as Vaults. Vaults allow users to customise parameters and choose which DeFi protocols to interact with. Users can deposit cryptoassets into Vaults so more experienced individuals can make investment decisions for them. MLN, the utility token of the network, can be used to participate in network governance by proposing and voting on protocol changes. Smart contract computations are performed by Ethereum, so fees for transactions are paid in ETH. Other fees are optional and applied at the discretion of Vault managers, who choose whether to charge management, performance or entrance fees to users contributing capital to their Vault.
The current price of MLN is $19.35. With 2,665,961 circulating tokens, Enzyme has the second largest market capitalisation at $51.59mm. A TVL of $161.2mm – the net sum of all cryptoassets locked in a project – exceeds all competitors and indicates that the community has greater trust in the protocol’s health, durability and utility. Index Coop is second with $69.6mm.
Enzyme’s high TVL drives a strong market cap/net assets ratio of 0.3 (lower than 1.0 is considered favourable). It is another sign that Cryptex Finance is overvalued, noting a market cap/TVL multiple of 30.3x. It is puzzling that the market cap of Enzyme is 198% greater than Cryptex, yet it has 281x as much crypto locked on its protocol. Noting that studies find TVL positively correlated with DeFi value, this suggests Cryptex is overvalued, Enzyme is undervalued, or both.
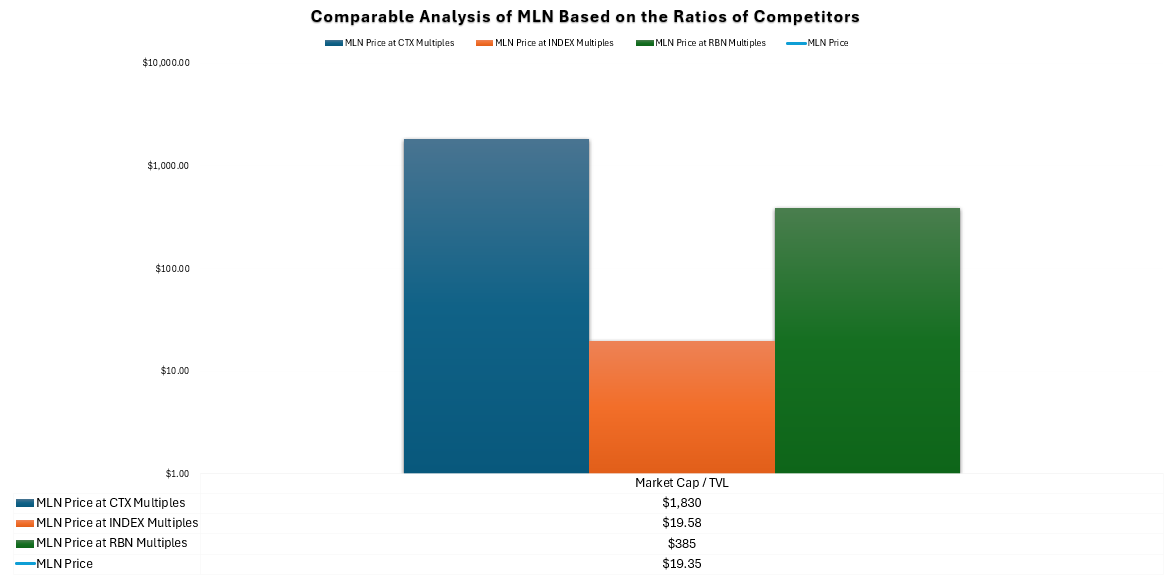
Unfortunately, we could not source revenues, fees or an estimate of Enzyme’s treasury, leaving us without three of four key ratios. It is, therefore, challenging to value MLN based on the ratios of its competitors. We can use market cap/TVL multiples but, noting our conclusion that CTX is overvalued, this analysis is also limited.
Considering the cohort, INDEX appears most appropriately valued and its multiple – 0.3 – is closely aligned with that of Enzyme. This multiple derives a price for MLN of $19.58, carrying potential upside of +1.2%. However, we reiterate that our analysis is limited by the lack of fundamentals.
Index Coop
Index Coop provides autonomous trading services and enables the creation and use of crypto indexes, which are tokens designed to track the value of a set of assets. Anyone, from finance professionals to DeFi experts, or developers to crypto enthusiasts, can create their own indices without technical expertise. The system also provides automatic rebalancing features so users can adjust their portfolios.
INDEX is a governance token used to vote on proposals, which include pitching new products, changes to existing products, external governance, treasury allocation decisions and more. Index charges annual fees based on the type of product: 1x- and 2x-leveraged products incur a 3.65% fee, while 3x-leveraged products carry a 5.48% fee. Additionally, all products are subject to issuance and redemption fees of 0.10%.
Of the maximum supply of 10 million INDEX tokens, 6,730,000 are in circulation. Each INDEX has a price of $3.35 for a market cap of $22.55mm. This is low compared to other asset management protocols and may be due to low fees generated by the network, which match reported revenues and indicate that Index does not reinvest much to improve the network. Accordingly, P/S and P/F ratios are both large at 55.6. Poor fee generation may weaken long-term utility as the protocol is less able to support itself as a decentralised business.
That said, users currently do find utility, given $69.62mm locked on the protocol. This is 4.4x higher than that on Ribbon Finance, despite the latter having a market cap 2.6x greater and drives a low market cap/TVL ratio for Index of 0.3, suggesting the protocol may be undervalued. To fund future projects, Index has $14.5mm in net assets; similar in size to Cryptex. Given their closely aligned market caps, Index Coop’s market cap/net assets ratio of 1.6 is expected.
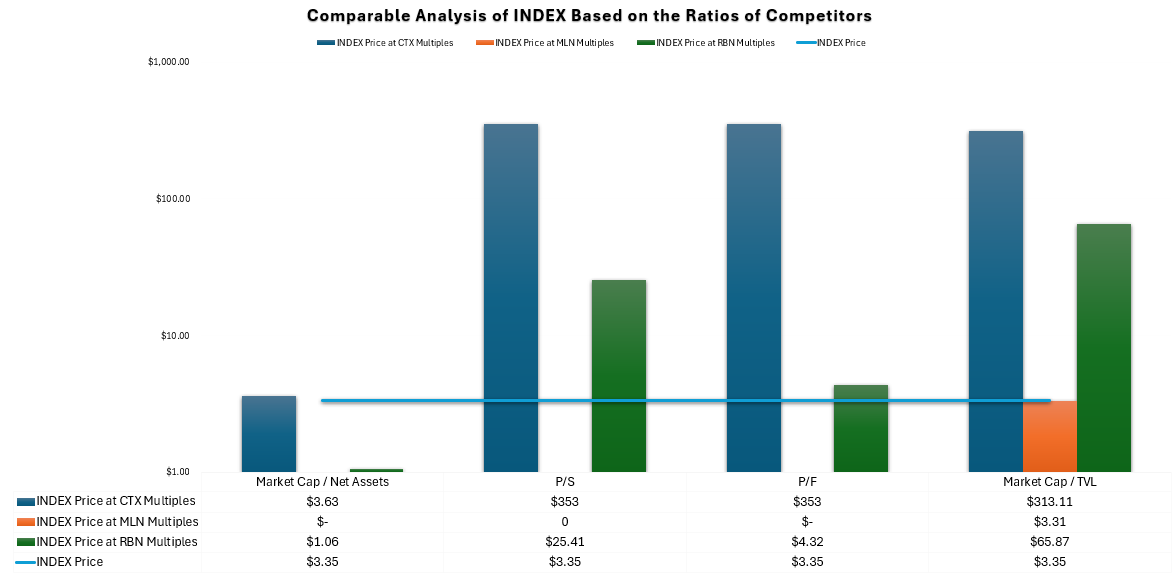
Using multiples of CTX and RBN, we find:
- INDEX is appropriately valued based on market cap/net asset ratios.
- INDEX is undervalued based on all other metrics.
It is immediately clear that INDEX is undervalued with the fundamentals of RBN and CTX. We use a logarithmic y-axis to project a 10,437% price increase to $313-$353 based on CTX. Thoughtful consideration deems this unreasonable, and a more prudent conclusion should be that CTX is overvalued.
We also see signs of overvaluation in RBN. Though suggesting a downside for INDEX based on market cap/net assets, deriving a price of $1.06, like CTX, the TVL of Ribbon Finance suggest INDEX could be priced at $65.87 (+1,866%).
In all, INDEX appears relatively undervalued. However, investors should exercise caution and not rely on relative valuation in isolation, since CTX and RBN both appear heavily overvalued. Intrinsic valuation is needed.
Ribbon Finance
Ribbon Finance is a suite of DeFi protocols giving users access to structured products. It takes 10% in performance fees and 2% in management fees. 50% of the protocol’s revenue is sent to the treasury, with the other 50% converted to ETH and distributed to veRBN holders for reliable-cash flow. Participating in governance requires an user to have vote-escrowed RBN (veRBN) or regular RBN (native token). Their product range encompasses:
- Theta Vaults: vaults offering a yield-oriented strategy for depositors to trade volatility on their underlying by selling European options. The value of options is set through auctions and determines the vault return. The vault reinvests premiums back into the strategy to compound them over time. Two types – covered calls and puts – are active.
- Ribbon Earn: these vaults employ fully funded strategies to capitalise on intra-week ETH movements (native token of Ethereum), whilst also ensuring users’ capital is protected. The vaults earn a base APY and use the remaining funds to purchase weekly options.
- Ribbon Treasury: these private vaults are built specifically for DAOs to run covered calls on their native tokens. The strategy is bespoke to each DAO based on customisable parameters.
Ribbon Finance has the largest circulating supply of the cohort. 149,794,061 tokens, each priced $0.55, drive the largest market cap of $81.76mm. Ribbon’s $166mm treasury is strong, indicating that the protocol has ample assets to fund projects, and a market cap/net assets ratio of 0.5 is lowest among its peers. Likened to price-to-book in traditional finance, 1.0 is considered healthy.
Ribbon’s other fundamentals are weak relative to its market capitalisation. Annualised revenues of $193,890 are just 47.8% of those generated by Index Coop and we see this reflected in P/S multiples: 55.6x for Index and 422x for Ribbon. Notably, Ribbon fails to secure much by way of pledged assets. Users have locked just $12.84mm on Ribbon: 18.45% of that on Index. This drives an unhealthy market cap/TVL ratio of 6.4, despite a market cap 2.6x greater than Index.
As we might expect from preceding analysis, relative evaluation suggests:
- RBN appears fairly valued based on market cap/net assets ratios of CTX and INDEX.
- Considering fees, revenues and TVL, RBN is heavily overvalued based INDEX ratios.
- Considering fees, revenues and TVL, RBN is undervalued based on CTX ratios.
The simplest comparison is market cap/net assets. CTX and INDEX suggest upside of 214-240%, reflecting the proximity of their original ratios. On this basis, RBN appears undervalued.
However, all other ratios suggest a range of prices. Cryptex multiples derive possible appreciation of 8,015% to $44.63. As CTX is heavily overvalued, we suggest RBN is more modestly valued. Noting conclusions for CTX, we reject these prices on the basis that Cryptex ratios are not appropriate for valuation.
It is challenging to conclude a reasonable price for RBN. Consideration for Ribbon’s own multiples suggests that it, too, is heavily overvalued. Of the cohort, only Index Coop looks appropriately priced. On this basis, we suggest RBN has downside at least as low as $0.42 (-23.6%) but possibly $0.03 (-94.6%).

In conclusion, asset management protocols look heavily overvalued. CTX and RBN have market caps that far outstrip the value locked on their protocols (30.3x and 6.4x, respectively), which indicates that users do not find much utility in them. This could diminish their long-term utility. Without key fundamentals of Enzyme Finance, the protocol is challenging to value, though we note that this business performs best on market cap/TVL (0.3). Index Coop looks heavily undervalued compared with Cryptex Finance and Ribbon Finance, and there may well be significant upside. However, we exercise caution based on our conclusions that Cryptex and Ribbon are overvalued and inappropriate to rely on for relative valuation.
Intrinsic Valuation
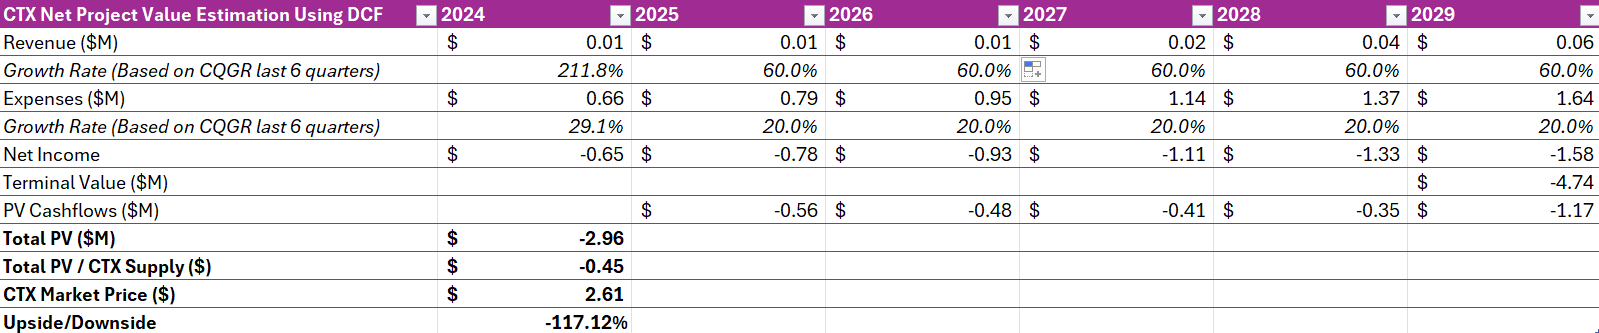
We use a discounted cash flow (DCF) model to perform intrinsic valuation. Compound revenue growth rate was calculated for each protocol across the last six quarters, from Q1-2023 to Q2-2024. We then took the average of each CQGR and applied that to each protocol for a five-year period. The same methodology was used to forecast the growth rate of expenses. Additionally, DeFi tokens face a higher risk so we discount their value by a higher factor. In Series A equity funding rounds for venture capital, the generally accepted rate is between 30–50% per annum. Several studies on the valuation of cryptoassets use 25-40%. We use 40%, noting low revenues generated by asset management protocols, with a perpetual growth rate of 5%.
| Group Perpetual Growth Rate | 5% |
| Group Discount Rate | 35% |
| Group Average Compound Quarterly Growth Rate – Revenues | 60% |
| Group Average Compound Quarterly Growth Rate – Expenses | 20% |
Date: 19 July 2024
Cryptex Finance
Index Coop

Ribbon Finance
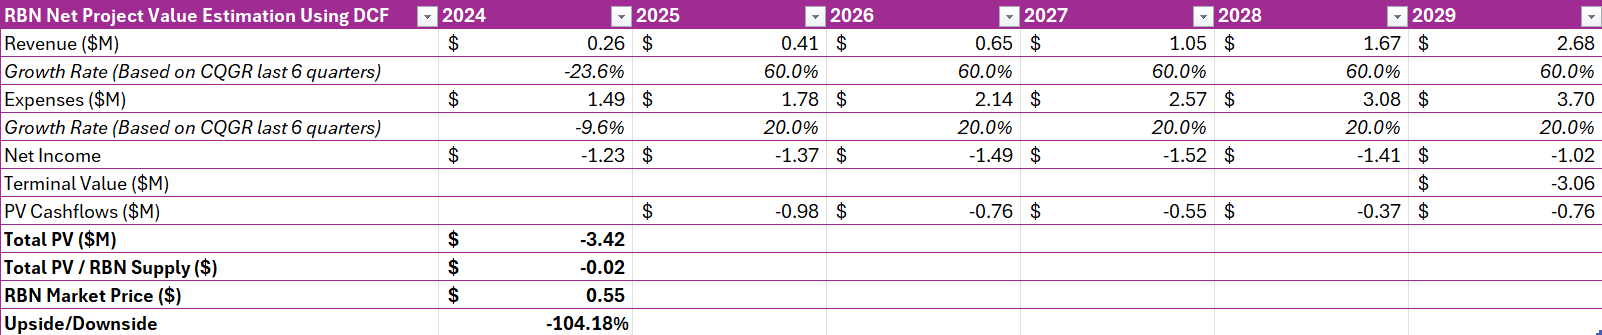
Projections show asset management tokens are heavily overpriced. Ribbon Finance and Cryptex both have extreme downside, with DCF analysis suggesting liquidation within the next five years. They have negative net assets and continue to be loss making. This is a poor outlook for any business and DeFi protocols are no different: they rely on revenues to support decentralised operations, such as paying fees to liquidity providers. Ribbon and Cryptex are currently very poor investments.
Enzyme could not be modelled due to lack of reported revenues or expenses. Index Coop, which relative analysis suggested could be undervalued, is also hyped, with significant downside of 56.43%.
It should be noted that our assumptions have been lenient on asset management protocols. Revenue growth at 60% per annum over the next five years is generous but does little to hide serious overvaluation. Bringing revenue growth down to 20% per annum gives Index Coop 78% downside to $0.73. These assets are also risky. Arguably, a discount rate of 40% is as low as should be applied, but even 30% does change things. INDEX would still show 30% downside to $2.34. Very little can change Cryptex or Ribbon – it requires revenue growth of 211.8% per annum and expense growth of just 3% per annum for the next five years to obtain a positive value (CTX = $0.01).
Asset Management protocols should be avoided in the current market.
Metelski, D., & Sobieraj, J. (2022). Decentralized Finance (DeFi) Projects: A Study of Key Performance Indicators in Terms of DeFi Protocols’ Valuations. IJFS, 10 (4), 1-23.
Pandit, M. (2021). Valuing AAVE. Available at: Medium (Accessed: 13 July 2024).
Soni, U., & Preece, R. (2023). Valuation of Cryptoassets: A Guide for Investment Professionals. Available at: CFA Institute.
Todaro, J. (2018). Valuing Crypto Assets using a DCF Model. Available at: Medium (Accessed: 13 July 2024).
Xu, T. A., Xu, J., & Lommers, K. (2022). DeFi vs TradFi: Valuation Using Multiples and Discounted Cash Flows. Papers 2210.16846, arXiv.org.
Disclaimer: This analysis is for informational purposes only and does not constitute financial advice. Readers are encouraged to conduct their own research and seek professional advice before making investment decisions.


Leave a comment