Decentralised Exchanges in Decentralised Finance
A NOTE ON DECENTRALISED EXCHANGE APPLICATIONS
Decentralised Exchanges (DEXs) are one of the most popular use cases of DeFi. In traditional finance, exchanges bridge trust, take custody of assets and complete transactions for participants by leveraging market makers and matching buy and sell orders on an order book. In DeFi, DEXs also bridge trust, but use smart contracts to algorithmically derive asset prices, automate market making and decentralise settlement.
DEXs create liquidity pools. Users deposit cryptoassets into pools, so liquidity is always available. Traders do not need to wait for another party to trade, rather, smart contracts predetermine asset prices and a trader can execute whenever. Users retain custody of their assets and earn interest, whilst DEXs generate revenue through transaction fees.
Different DEXs exist. In asset selection, we must reason why an investor should prefer one over another. We provide both a fundamental and relative valuation analysis for several leading DEXs in the space. See calculation terminology here.

FINANCIAL DATA
| Platform | Native Token | Price | Circulating Supply | Market Cap |
|---|---|---|---|---|
| 1Inch Network | 1INCH | $0.41 | 1,254,333,269 | $517,663,340 |
| Balancer | BAL | $2.62 | 57,883,487 | $151,654,736 |
| Bancor | BNT | $0.63 | 125,657,580 | $79,076,315 |
| Curve | CRV | $0.28 | 1,187,160,248 | $334,185,610 |
| DODO | DODO | $0.12 | 614,617,713 | $73,631,202 |
| IDEX | IDEX | $0.04 | 807,488,993 | $34,592,828 |
| PancakeSwap | CAKE | $2.01 | 229,177,059 | $460,645,889 |
| SushiSwap | SUSHI | $0.71 | 277,733,522 | $198,190,641 |
| Uniswap | UNI | $7.80 | 600,034,295 | $4,680,267,501 |
Source: CoinMarketCap
Date: 19 July 2024
| Platform | Treasury | Annualised Revenues | Annualised Fees | Total Value Locked |
|---|---|---|---|---|
| 1Inch Network | $14,600,000 | $42,930 | $42,930 | $5,590,000 |
| Balancer | $16,900,000 | $5,770,000 | $11,240,000 | $815,010,000 |
| Bancor | $4,200,000 | $294,320 | $334,280 | $61,920,000 |
| Curve | $13,510,000 | $7,050,000 | $14,050,000 | $1,120,000,000 |
| DODO | $45,450,000 | $462,080 | $2,310,000 | $43,890,000 |
| IDEX | – | – | – | $2,810,000 |
| PancakeSwap | $322,500 | $45,150,000 | $138,610,000 | $1,620,000,000 |
| SushiSwap | $39,320,000 | $1,670,000 | $10,730,000 | $253,440,000 |
| Uniswap | $3,180,000,000 | – | $767,300,000 | $6,850,000,000 |
Source: Token Terminal
Date: 19 July 2024
| Platform | Market Cap to Net Assets | Price to Sales | Price to Fees | Market Cap to TVL |
|---|---|---|---|---|
| 1Inch Network | 35.5x | 12,058x | 12,058x | 92.6x |
| Balancer | 9.0x | 26.3x | 13.5x | 0.2x |
| Bancor | 18.8x | 268.7x | 236.6x | 1.3x |
| Curve | 24.7x | 47.4x | 23.8x | 0.3x |
| DODO | 1.6x | 159.3x | 31.9x | 1.7x |
| IDEX | – | 12.3x | ||
| PancakeSwap | 1,428x | 10.2x | 3.3x | 0.3x |
| SushiSwap | 5.0x | 118.7x | 18.5x | 0.8x |
| Uniswap | 1.5x | – | 6.1x | 0.7x |
Date: 19 July 2024
| Token | Revenue Q1-23 ($) | Revenue Q2-24 ($) | CQGR | Expenses Q1-23 ($) | Expenses Q2-24 ($) | CQGR |
|---|---|---|---|---|---|---|
| 1INCH | 1,520,000 | 38.090 | -45.9% | 225,180 | 9,360 | -41.1% |
| BAL | 3,280,000 | 2,020,000 | -7.8% | 14,550,000 | 5,130,000 | -15.9% |
| BNT | 380,550 | 191,930 | -10.8% | 79,710 | 32,750 | -13.8% |
| CRV | 4,720,000 | 2,520,000 | -9.9% | 44,740,000 | 17,590,000 | -14.4% |
| DODO | 266,410 | 172,780 | -7.0% | 656,120 | 399,250 | -7.9% |
| IDEX | 216,170 | 212 | -68.5% | – | – | – |
| CAKE | 11,710,000 | 17,680,000 | 7.1% | 97,540,000 | 10,000,000 | -31.6% |
| SUSHI | 3,210,000 | 805,690 | -20.6% | 1,890,000 | 74,170 | -41.7% |
| UNI | – | – | – | 152,440 | 90,300,000 | 189.8% |
Date: 19 July 2024
Relative Valuation
1Inch Network
1Inch Network is a DEX aggregator, scraping numerous exchanges in search of the most profitable platforms for liquidity. The protocol splits orders across multiple DEXs to find the best market price using arbitrage bots on Ethereum, BNB Smart Chain and Polygon. The native token, 1INCH, is used for holding, sending or spending value and can be staked to partake in governance.
Priced at $0.41 per token with over 1.1bn in circulation, 1Inch Network has a market capitalisation of $517.7mm. This makes it second most valuable DEX, but its market cap is 12,058x both fees and revenues which, annualised at $42,930, are lowest of the cohort. This is very high, noting P/F multiples of PancakeSwap and Uniswap are 3.3x and 6.1x, respectively, and suggests 1INCH is overpriced. A small treasury drives a market cap/net assets ratio of 35.5, supporting this. Likened to price-to-book in traditional finance, a ratio at or less than 1.0 is considered healthy, yet 1Inch’s price is 35.5x its net assets. Lastly, just $5.59mm is locked to calculate a market cap/TVL ratio of 92.6 – highest of the group by far. As with price-to-book, 1.0 is considered healthy, and TVL has also been positively correlated with DeFi valuation. Large TVL indicates high user engagement and signals a platform’s ability to facilitate DeFi services and create opportunities for users to earn. 1Inch’s is low and we suggest the market has not appropriately considered this. On all four ratios, 1INCH is overvalued.
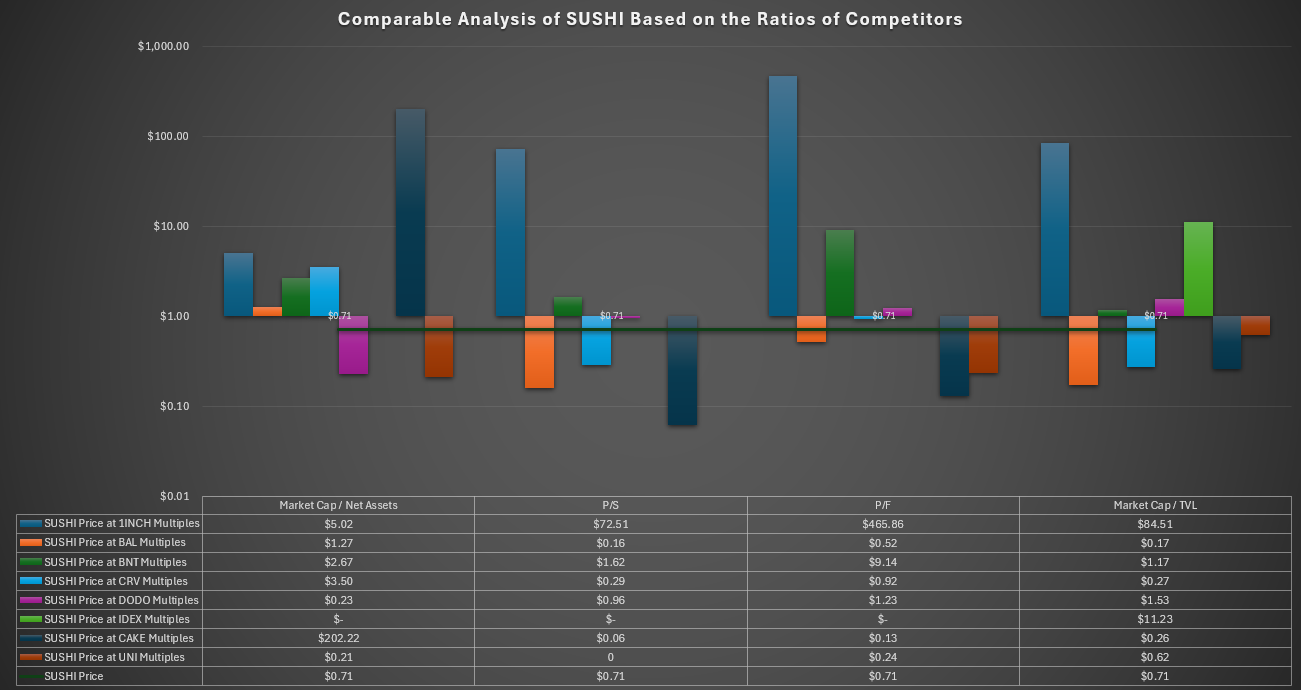
Comparable analysis supports our initial findings:
- 1INCH is overvalued based on 27/28 comparisons.
- P/F and market cap/TVL ratios of competitors suggest a price for 1INCH below $0.01.
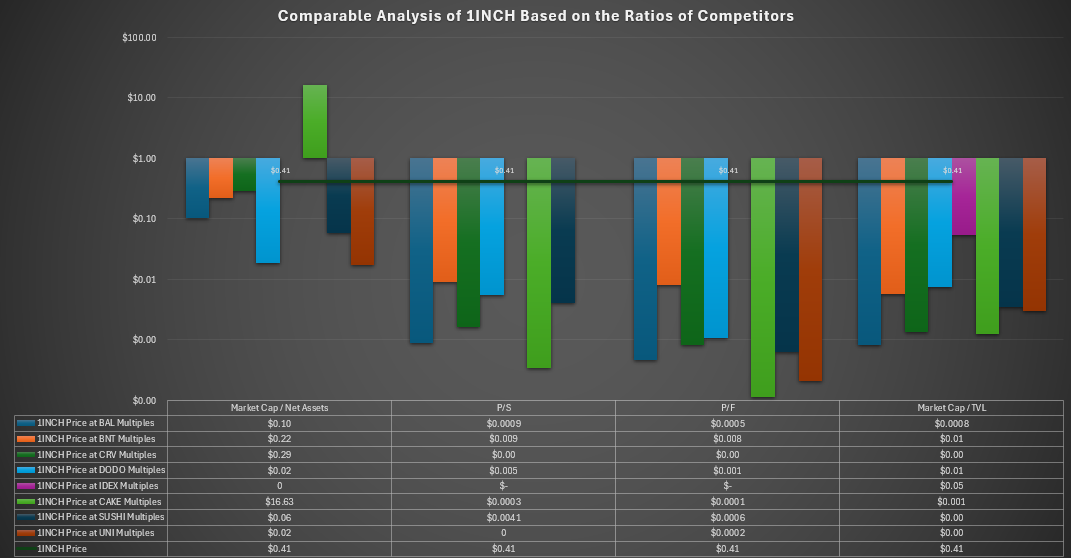
The majority of derived prices fall well below 1INCH’s market price, strongly indicating overvaluation. Most multiples derive a price below $0.01, even as low as $0.0001, for a 99.6-99.98% downside.
We see the effect of TVL on DeFi valuation. All networks suggest 1INCH is overvalued with this metric, showing an 87.8% drop to $0.05 but possibly as steep as 99.8% to $0.0008. Given TVL is one of the most positively correlated factors in valuation, we conclude 1INCH is overvalued.
CAKE’s market cap/net assets multiple stands out, deriving $16.63. However, noting analysis of CAKE below, and the scale of contradiction to most projections for 1INCH, we disregard this.
Relative analysis suggests 1INCH has huge downside and is an asset to avoid. A reasonable price would almost certainly take it below $0.001 and we expect intrinsic valuation to support.
Balancer
Balancer is an automated portfolio manager and liquidity provider. Users create funds, known as Balancer pools, based on cryptoassets in their portfolio, and users wishing to provide liquidity can deposit assets into the pools. Deposits are essential, providing liquidity for users. Liquidity providers earn a portion of the fees paid to Balancer for use of their funds and are rewarded with Balancer’s native token, BAL.
Balancer has the 6th highest market cap. Very few tokens are in circulation relative to its competitors, driving the second highest price of $2.62.
Balancer’s main strength is the value locked on its protocol. Users have deposited $815mm, indicating significant engagement and support, and gives a strong market cap/TVL ratio of 0.2. This is joint lowest in the cohort, alongside PancakeSwap. Noting the correlation between TVL and DeFi valuation, such a low multiple is a sign that Balancer may be undervalued.
Balancer’s P/F multiple of 13.5x is also strong and suggests the market expects Balancer to collect fees over the long-term. Of the $11.24mm fees generated, $5.77mm are distributed as revenues, meaning $5.39mm (48%) is retained for reinvestment into the platform. Balancer also has a treasury to support funding which, with $16.9mm in net assets, is similar in size to competitors. But its market cap/net assets ratio of 9.0 is weak – 1.0 is considered healthy – and may signal overvaluation.
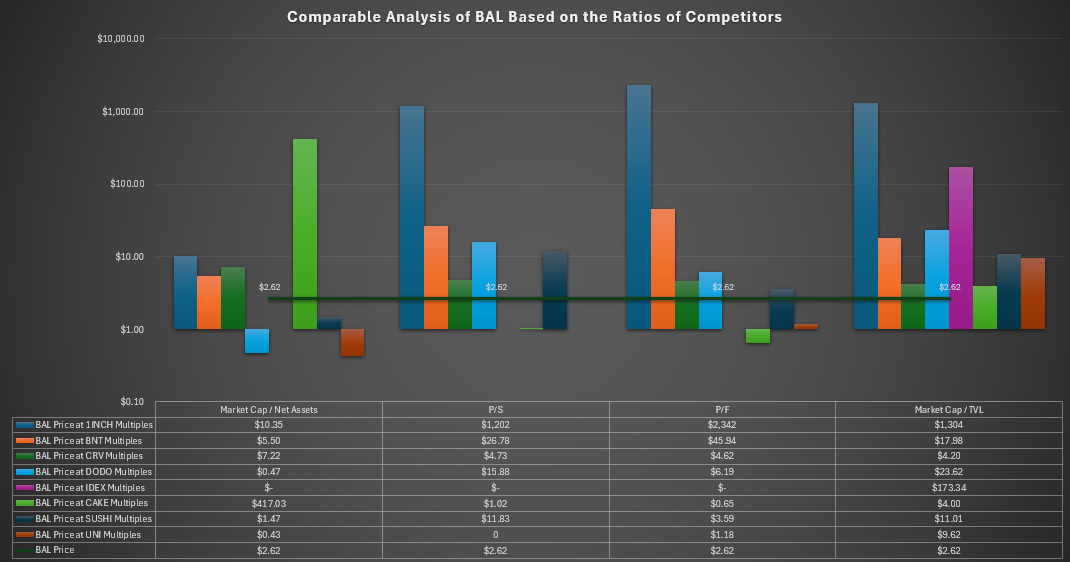
Comparable analysis provides further insight:
- Like 1INCH, CAKE’s market cap/net assets multiple marks BAL as undervalued.
- BAL is largely undervalued based on the ratios of competitors.
- BAL is undervalued considering its TVL.
Though covered below, our full assessment suggests CAKE is hugely overvalued if we solely consider PancakeSwap’s net assets. A market cap/net assets multiple of 1,428x far exceeds any other DEX and creates outliers in every analysis, as here to value BAL at $417. We exclude this multiple going forward.
Applying P/S, P/F and market cap/TVL ratios largely suggests BAL is undervalued. Curve places BAL between $4.20-4.73, SushiSwap between $3.59-$11.83 and UNI at $9.62 (though UNI’s P/F projects downside to $1.18). BAL’s TVL also appears to not be baked into current price, with at least $4.00 projected and many taking it beyond $10. This reflects Balancer’s low market cap/TVL multiple of 0.2. Considering the value locked on Balancer and the market’s treatment of DEXs as a cohort, we suggest BAL has upside.
PancakeSwap is the exception, deriving a price of $0.65-$1.02 which would imply BAL’s market price may be 3x its true value. Full analysis of the cohort suggests PancakeSwap and Uniswap are two of the more appropriately valued, perhaps even undervalued, protocols. It is therefore challenging to suggest a price for BAL using relative analysis alone. CAKE multiples draw BAL down to $0.65 (-75.5%), but UNI presents $9.62 as a possibility (+267%). Intrinsic valuation is required.
Bancor
Bancor incentivises users to lock their cryptoassets in liquidity pools in exchange for a share of the fees paid when assets are traded. This creates an automated market maker mechanism, providing liquidity without needing a financial institution to manage it directly. Whenever a trade is executed on Bancor, tokens are converted into BNT and liquidity providers (who deposited the assets) generate a return from their funds.
125,657,580 BNT are in circulation, each priced $0.63, giving Bancor a market capitalisation of $79mm. It is the 7th most valuable DEX and has the 7th largest treasury: $4.2mm. Fees and TVL are most associated with value in DeFi and Bancor is weak here. $334,280 of annualised fees is 7th lowest of the cohort, calculating a P/F multiple of 237x. Almost all fees convert to revenue, so Bancor’s P/S multiple is 268.7x. This is poor and suggests the market has not appropriately considered BAL’s fundamentals. $61.92mm locked on the protocol drives a market cap/TVL of 1.3, lower than some peers but above 1.0. Initial analysis suggests Bancor is overvalued.
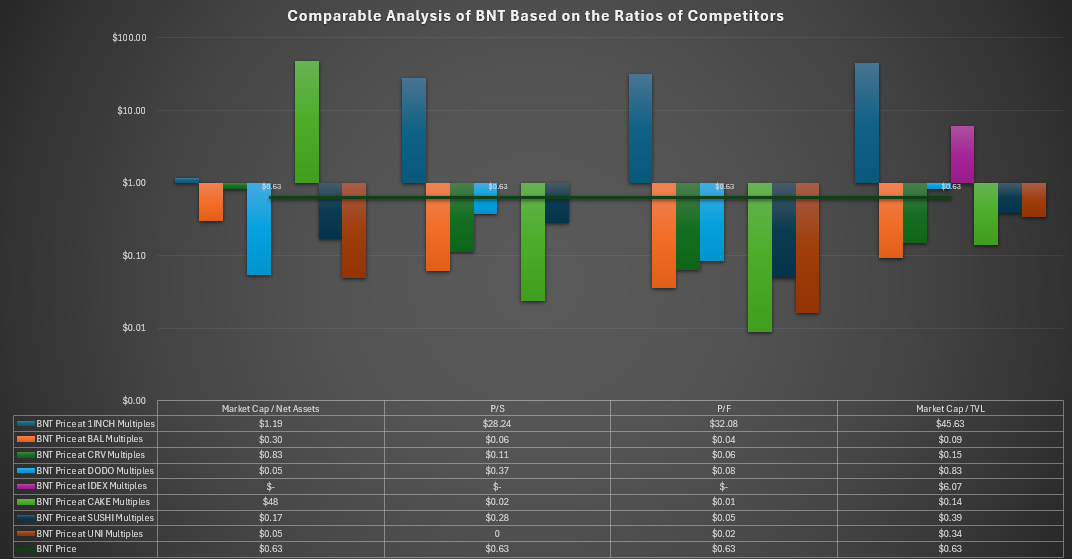
Comparable analysis supports:
- BNT is undervalued using multiples of 1INCH.
- BNT is overvalued in most instances based on P/F and market cap/TVL.
1INCH suggests a price between $28.24-$45.63: a 4,383%-7,143% upside. Full analysis of the cohort indicates 1INCH is heavily overvalued and its multiples not appropriate.
Other multiples also suggest BNT is overvalued. No P/F or market cap/TVL multiples from BAL, CRV, CAKE, SUSHI or UNI offer a price higher than $0.39 (-38%). SushiSwap and Uniswap might be considered best for comparison, noting their market cap/TVL ratios of 0.8 and 0.7. Though they suggest BNT is overvalued, the downside is not as drastic as that suggested by other DEXs.
Based on relative analysis alone, it is challenging to calculate a reasonable price for BNT. Consideration for Bancor’s TVL suggests a price around $0.39, but the fees Bancor recoups are weak and could lower this to $0.06 (-90.48%). Intrinsic analysis is required to improve our calculation.
Curve
Curve facilitates trading using pools of cryptoassets supplied by users, who in turn earn a portion of the fees from trades and a return on deposits. Users lock cryptoassets in lending pools so they can be traded by others and Curve keeps assets in certain ratios so that, as amounts fluctuate, tokens become cheaper or more expensive. However, the platform’s USP is its focus on stablecoins, using a bonding curve to enable the trading of large sums of different stablecoins with less change in their relative prices.
CRV, Curve’s native token, is used to vote on proposals that govern the protocol. 2 million are released daily.
Curve has the largest circulating supply of all DEXs, with 1.19bn tokens. The market price of one CRV is $0.28, so Curve is the fourth largest DEX by market capitalisation ($334mm). A treasury of $13.51mm aligns with DEXs analysed previously, but is small, meaning Curve’s market cap is 24.7x its net assets. This is poor given a ratio of 1.0 is considered healthy and Curve is also valued at significant multiples of its fees (23.8x) and revenues (47.4x). We note these are not out of touch with the cohort but may indicate that DEXs are generally overvalued given the fees they generate.
Users have pledged $1.12bn to the network – third highest of the group and Curve’s biggest strength. It drives a market cap/TVL ratio of 0.3 which signals possible undervaluation.
Comparable analysis paints a mixed picture:
- CRV appears heavily undervalued based on ratios of 1INCH.
- CRV is overvalued based on market cap/net asset ratios.
- A price band appears between $0.06-$0.22.
The cohort supports overvaluation based on market cap/net assets, highlighting the weakness of Curve’s treasury. Given its market cap, we could expect far higher net assets and conclude that Curve is overvalued on this metric.
Similarly to BAL and BNT, CRV looks undervalued compared to 1INCH. This is a recurring theme and, coupled with analysis of 1INCH, suggests that this protocol is overvalued rather than CRV undervalued.
P/F multiples of PancakeSwap, Uniswap and Balancer derive a price for CRV of $0.04, $0.07 and $0.16 respectively, whilst market cap/TVL multiples of PancakeSwap and Balancer give $0.27 and $0.18. They present a possible downside of 3.6-85.7%. SushiSwap’s P/F multiple gets a price of $0.22 (-21.4%), though its market cap/TVL presents upside to $0.74 (+164%).
In all, the price banding is scattered, and relative valuation alone is not enough to pinpoint a price. The spread of derived prices across all DEXs suggests the majority may be overvalued, but intrinsic valuation is required to investigate further.

DODO
DODO aggregates liquidity from various sources. Its unique feature is the Proactive Market Maker (PMM) algorithm that facilitates token swapping, limit orders and liquidity provision. PMMs differ from conventional automated market makers (AMMs) by automatically changing liquidity search parameters (e.g., pool ratios and price curves) to adapt to market conditions.
DODO also supports creation and trading of non-fungible tokens (NFTs). The native token, DODO, can be used to vote on governance, participate in pooling and receive fee discounts.
Priced at $0.12, DODO has a market capitalisation of $73,631,202. It is the 8th largest exchange, ahead of only IDEX. Yet, DODO has the second largest treasury, holding $45.45mm in net assets. This supports one of the healthiest market cap/net assets ratios, 1.6, bettered only by Uniswap and seems to contribute significantly to the market’s valuation of DODO.
The protocol is weak on TVL. $43.89mm is 7th highest and appears to be less reflected in its market cap than other DEXs. A ratio of 1.0 is considered healthy, and 1.7 exceeds all DEXs other than 1INCH and IDEX (which both appear heavily overvalued). DODO may also be overvalued.
The protocol collects $2.31mm in fees, of which $462,080 is recorded as revenue. This leaves 80% available for reinvestment, but is a low sum compared to competitors which may weaken DODO’s long-term prospects. A large treasury can prop up project development, but fee reinvestment contributes to constant upgrading of the protocol. P/F and P/S ratios of 31.9 and 159.3 are high and indicate the market has overpriced DODO.
Comparable analysis supports:
- DODO is undervalued considering its treasury.
- DODO is largely overvalued across fees, revenues and TVL.

As expected, given how conservative DODO’s market cap/net assets ratio is, the protocol looks undervalued when applying the fundamentals of competitors. However, likening this ratio to a traditional price-to-book, 1.0 is considered healthy. We consider that DODO’s, at 1.5, may not be undervalued, but other DEXs overvalued. The closest projection of $0.37 uses SushiSwap’s multiples. On this basis, DODO’s market price has upside, but we argue that the market overvalues the net assets of DEXs.
Applying the fees and TVL of competitors, DODO has significant downside. $0.07 appears the highest rational price, a drop of 41.67%, with SushiSwap and Balancer settling around this level. But Uniswap and PancakeSwap suggest $0.01-0.05: a downside between 58%-92%.
We conclude DODO is overvalued. The market places too much emphasis on DODO’s treasury, failing to appropriately factor the value locked on the protocol. Intrinsic valuation may provide more insight, but relative analysis suggests a rational price around $0.05.
IDEX
IDEX is a hybrid liquidity DEX that merges the traditional order book model with an AMM. It aims to combine an off-chain trading engine with on-chain settlement to eliminate failed trades and unnecessary fees, enable instant execution and implement advanced trading strategies. The off-chain trading engine processes and executes trades in an off-chain order book. Only when a trade is matched and executed is the transaction settled on-chain, avoiding additional network costs for placing and cancelling orders.
IDEX operates on both Ethereum and Binance Smart Chain. When users stake IDEX, they are rewarded with trading fees.
The price of IDEX is low, at $0.043. It has the lowest market capitalisation by some distance – $34,592,828 – despite 807mm circulating tokens. With no recorded treasury, fees or revenues, we omit IDEX’s respective ratios from this analysis. However, TVL is reported and suggests overvaluation.
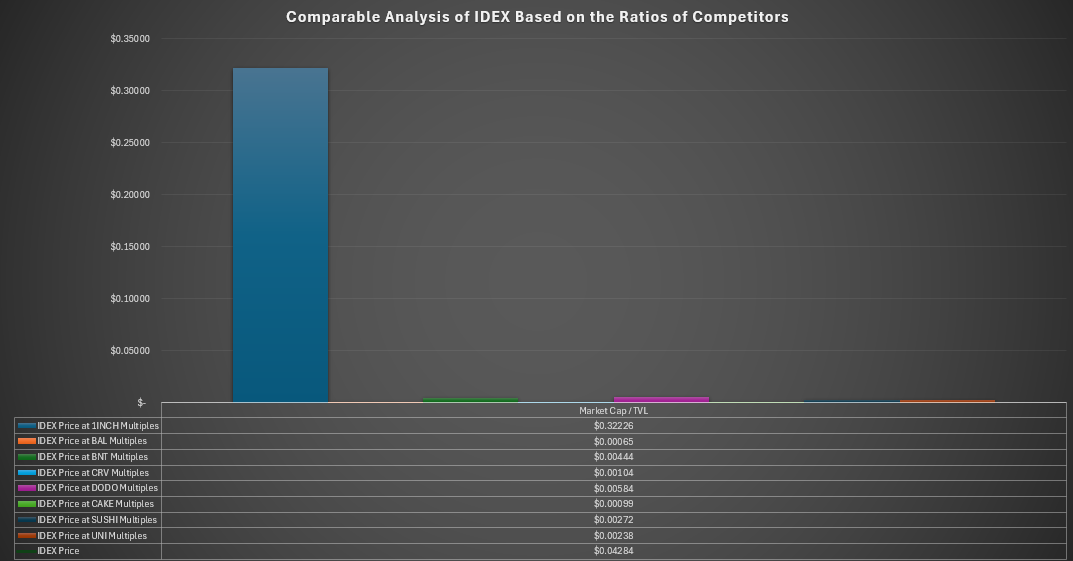
Just $2.81mm locked on the protocol – lowest of the cohort – gives a market cap/TVL ratio of 12.3 and suggests a lack of utility. Low TVL undermines the robustness of the network, and the high multiple is a prime indicator that IDEX is overvalued.
Only one metric contradicts overvaluation – that of 1Inch Network – but this may be expected noting 1INCH is also overvalued. In most instances, IDEX falls well below $0.001, and the most severe outcome applies derives a price of $0.00065 (-98.5%). Based on its fundamentals and the multiples of competitors, IDEX has serious downside. It is difficult to determine what the market has priced into IDEX aside from more generalised hype around decentralised exchanges.
Relative analysis suggests a reasonable price below $0.003 (-93%).
PancakeSwap
PancakeSwap is native to BNB Chain. It shares similarities with other platforms, like Uniswap, and allows users to exchange tokens without relying on intermediaries. But PancakeSwap focuses on BEP20 tokens – the specific standard developed by Binance. Users can earn the native token, CAKE, by staking tokens into liquidity pools.
Since it runs on BNB Chain, not Ethereum, PancakeSwap offers lower trading fees (as low as 0.2% per trade) and reduces costs to deposit assets for staking.
PancakeSwap is the third largest DEX, with 229mm tokens priced $2.01 to give it a market capitalisation of $460mm. We might expect PancakeSwap to hold a high TVL, and this is the case: $1.62bn. Yet, a market cap/TVL ratio of 0.3 suggests CAKE may be undervalued. TVL is a key metric – such large sums locked on the protocol is indicative of widespread support for the network. Uniswap is valued 9.16x greater than PancakeSwap but has only 3.23x more committed capital. The market appears to underappreciate the utility PancakeSwap offers.
The protocol also generates substantial fees, pulling in $138,610,000 per annum. 32.57% is distributed as revenue, leaving plenty to fund protocol upgrades. Using P/F, we observe relative undervaluation compared to competitors: PancakeSwap’s market cap is just 3.3x its fees, implying the market is not confident the protocol can continue generating such high fees. All other protocols have far higher P/F multiples, with the majority between 13x and 32x.
The cause of this apparent undervaluation may be PancakeSwap’s treasury. The protocol holds just $322,500 in net assets and has a market cap/net assets ratio of 1,428. The DEX nearest to this is 1Inch Network, with a ratio of 35.5. PancakeSwap’s is outsized.
Comparable analysis finds:
- CAKE is hugely overvalued given its treasury.
- CAKE is undervalued on all other metrics.
- PancakeSwap’s treasury may be suppressing its price.
As identified early on, PancakeSwap is overvalued considering its treasury in isolation. All other protocols project downside of at least 97.5%, but possibly as far as 99.9% to $0.0021. Broadly, the market does not consider net assets a critical determinant of DEX value, rather leaning on TVL and fees. Yet, for CAKE, a weak treasury may be suppressing its price, since it is undervalued on all other fundamentals.
If PancakeSwap can increase its treasury, it may unlock substantial upside. We consider Uniswap and SushiSwap as most appropriate to compare TVL, given ratios of 0.7 and 0.8. They project a price of $4.83 (+140%) and $5.53 (+175%), respectively. However, Balancer, with a market cap/TVL ratio similar to PancakeSwap, shows downside of -34.33%.
Appreciation for the fees PancakeSwap generates would also support upside. Balancer, with a ratio of 13.5, projects $8.16 (+306%); SushiSwap, at 18.5, projects $11.17 (+456%).
Relative analysis suggests that PancakeSwap is largely undervalued and a weak treasury suppressing its price. We conclude that PancakeSwap may have upside to $5-$11. Intrinsic valuation is required for more accuracy.

SushiSwap
SushiSwap runs on Ethereum and seeks to incentivise network users to provide liquidity to a platform. It uses liquidity pools to achieve this, with users locking assets into smart contracts so traders buy and sell cryptoassets from those pools, swapping out one token for another. This means trading can occur without the need for a centralised authority.
Governance decisions relating to DEXs are made by holders of native cryptocurrency, in this case SUSHI. Anyone holding SUSHI can propose changes to how SushiSwap operates.
SushiSwap is one of the smaller DEXs, coming in 5th at $198,190,641. Each SUSHI is $0.71 and there are currently 277,733,522 in circulation. SushiSwap’s fundamentals place it in good stead compared with other exchanges: a market cap/TVL ratio of 0.8 is healthy and considered well valued. $253,440,000 is locked on the protocol – 5th highest – in line with its market cap. Users clearly find value in the protocol and commit capital in support. Annualised fees of $10.73mm are 5th highest, driving a P/F multiple of 18.5x. Just 15.56% ($1.67mm) is recorded as revenue, suggesting SushiSwap has the potential to reinvest $9.06mm per annum into improving the protocol. This is strong, third highest of the cohort, but sits far below the investment PancakeSwap and Uniswap can make. It is a factor to consider for the long-term competitiveness.
Lastly, SushiSwap holds net assets of $39.32mm, meaning its market cap is 5x its treasury. This is far from a healthy ratio of 1.0 but is not as weak as some competitors. The market cap/net assets ratio finds most DEXs are valued at multiples of their treasury, which may imply either widespread overvaluation or that the market does not consider net assets to be a leading driver of DeFi value.
Comparable analysis finds:
- SushiSwap is currently in an appropriate price range.
By now, the notion that 1INCH is overvalued is clear and this analysis provides supports. But it also suggests DODO may be overvalued, noting P/F and market cap/TVL ratios project upside for SUSHI between $1.23 (+73%) and $1.53 (+116%). Bancor also appears overvalued, its P/F multiple calculating a near 12-fold increase in SUSHI’s current price.
Uniswap, which has a market cap/TVL ratio of 0.7, suggests minor downside to $0.62 (-12.7%). Uniswap’s P/F multiple is much lower than SushiSwap’s, giving downside to $0.26. Equally, PancakeSwap shows downside across the board, as low as $0.06 based on P/S. Our view is that P/F and market cap/TVL more appropriately reflect valuation, so $0.26 comes into scope. However, PancakeSwap’s low multiple of 0.2 for market cap/TVL has already led us to conclude CAKE is relatively undervalued, and we reaffirm this finding based on comparable analysis of SushiSwap.
On other fundamentals for which we have found DEXs to be appropriately valued – consider Bancor’s market cap/TVL, or Balancer’s P/F – a price band forms between $0.52-$1.17. SushiSwap is currently in this range, and we deem this appropriate.
Uniswap
Uniswap enables peer-to-peer market making on Ethereum, supporting the exchange of any digital token that adheres to Ethereum’s technical standards (ERC-20). As with other DEXs, users can securely create liquidity pools and the protocol uses smart contracts to automate token exchange and rebalance pools after a trade. Users who support the pool are allocated a portion of fees and newly minted UNI.
Uniswap is the largest DEX, by some way. Its market capitalisation of $4.68bn is 9.16x greater than its nearest competitor, PancakeSwap. It has 600,034,295 UNI tokens in circulation, each priced at $7.80.
Noting its market cap, we might expect substantial value locked on the protocol. That is the case: Uniswap has a TVL of $6.85bn for a healthy market cap/TVL ratio of 0.7, which suggests the protocol is valued appropriately. Uniswap also has the lowest market cap/net assets ratio, despite its size, owing to a treasury of $3.18bn. This huge sum is at the network’s disposal to support future upgrades and is indicative of a plan to support long-term utility. Annualised fees of $767,300,000 are also the largest generated by any DEX and 4.5x the sums generated by PancakeSwap (second highest with $138.6mm). Again, this speaks to Uniswap’s ability to invest into the platform and, notably, Uniswap currently does not record revenues. It may be that the network is reinvesting all fees back into the protocol or storing them in the treasury for future. Given the lack of fundamental data, we omit Uniswap’s P/S multiple from analysis.
Comparable analysis suggests:
- UNI may be valued appropriately.
- CAKE appears undervalued considering P/F and market cap/TVL metrics.
Despite Uniswap’s market cap/TVL ratio of 0.7 (considered a strength), due to the lower ratios of competitors – namely, Balancer, Curve and PancakeSwap – Uniswap looks overvalued. Competitors show possible downside of 72.8% ($2.12), 56.3% ($3.41) and 58.3% ($3.25), respectively. Yet, this reflects the relative undervaluation of Balancer and PancakeSwap, with ratios of 0.2 and 0.3, rather than downside for Uniswap.

Aside from PancakeSwap, P/F and market cap/net asset multiples of these same competitors give UNI upside between $17.25 (+121%) and $131.09 (+1,581%). This is excessive – both Balancer and Curve were found overvalued based on market cap/net assets. Though DODO suggests a price between $8.59-$40.76, it, like many in the cohort, has an outsized P/F ratio, reducing reliability of the metric.
TVL is most appropriate. Given its fundamentals, and considering our findings for other DEXs, we conclude UNI is well valued, if not slightly undervalued by the market. We are again led to believe the competition is overvalued, except for CAKE, which calculates a low price for UNI of $3.25 with its market cap/TVL. We suggest that the market has not appropriately accounted for the value locked on PancakeSwap, despite TVL appearing a critical determinant of value, evident in Uniswap’s large market capitalisation.
Intrinsic Valuation
We use a discounted cash flow (DCF) model to perform intrinsic valuation. Compound revenue growth rate was calculated for each protocol across the last six quarters, from Q1-2023 to Q2-2024. We then took the average, which came out at -18%. Growth in expenses averaged 3%. Considering the bear market between 2022-2024, this may be expected: fewer users mean fewer fees collected and less revenue paid to liquidity providers. Lower revenue also diminishes what could be paid out as expenses, for protocol initiatives or other.
Optimistic of an upturn in DeFi, we instead apply a 15% growth rate to revenues and 14% for expenses for the next five years. DeFi tokens face higher risk so we must discount their value by a higher factor. In Series A equity funding rounds for venture capital, the generally accepted rate is between 30–50% per annum. Several studies on the valuation of cryptoassets use between 25-40%. We use 30%, with a perpetual growth rate of 5%.
| Group Perpetual Growth Rate | 5% |
| Group Discount Rate | 30% |
| Compound Quarterly Growth Rate – Revenues | 15% |
| Compound Quarterly Growth Rate – Expenses | 14% |
Date: 19 July 2024
1Inch Network

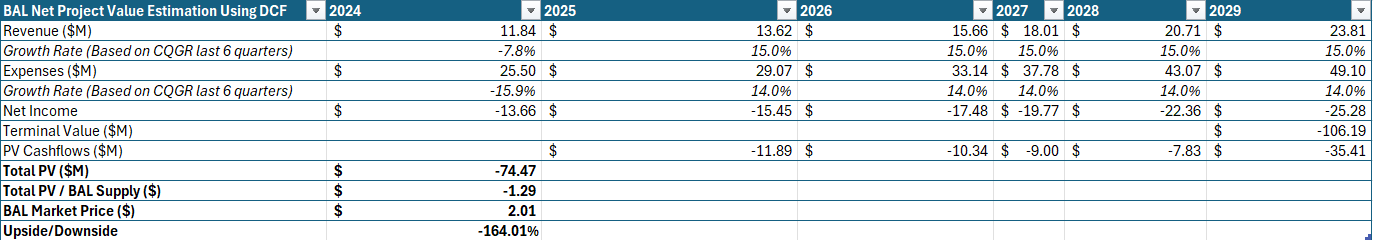
Balancer
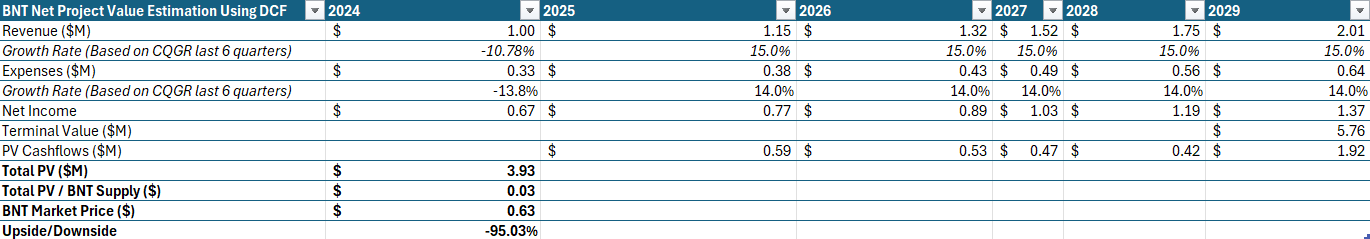
Bancor
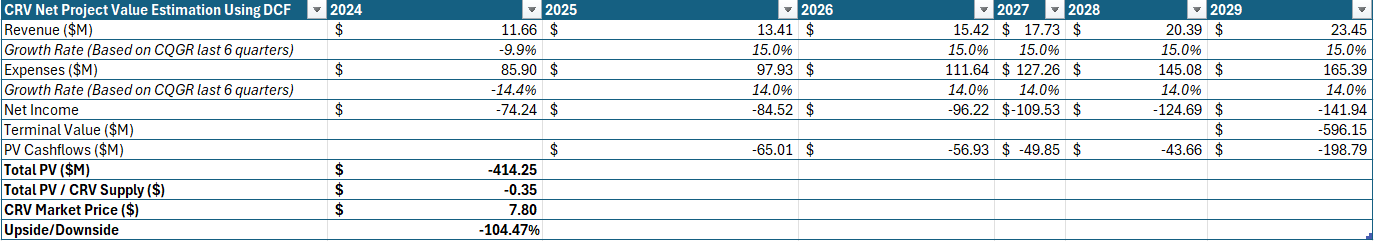
Curve
DODO

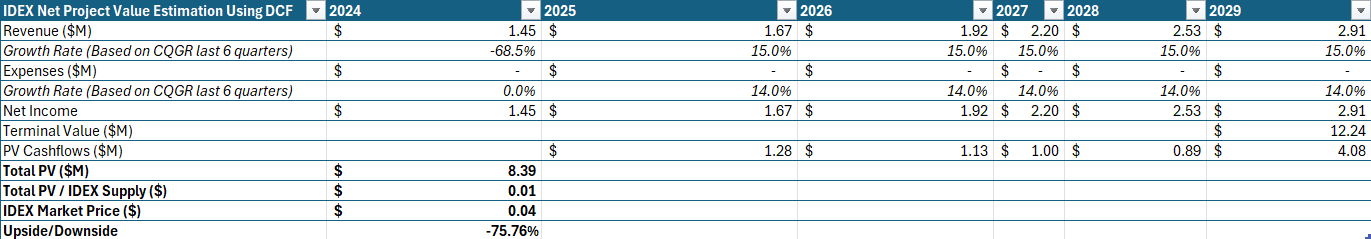
IDEX
PancakeSwap

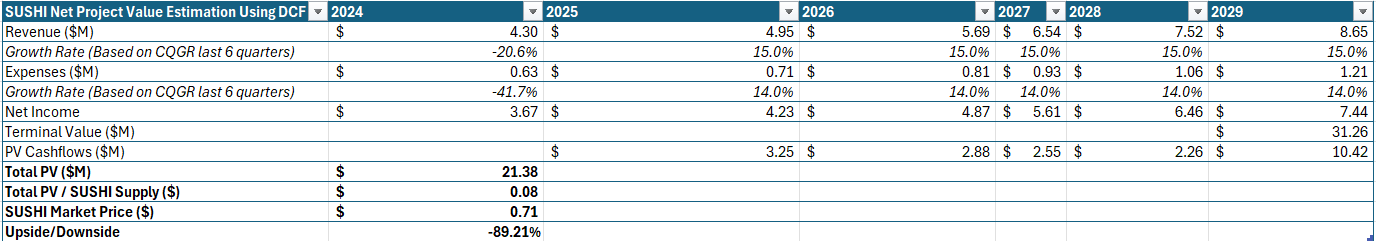
SushiSwap
Uniswap

Across the board, DEX tokens are overvalued. Several protocols are currently loss-making – Balancer, Curve and DODO – deriving negative present value. Curve shows severe negative net income, with expenses outweighing revenues over 7:1. It will require serious change for any of these protocols to generate profit. Our analysis concludes that they are not viable investments.
1INCH, as expected, has severe downside. Comparable analysis suggested a price around $0.001; we observe that here with 99.69% downside to $0.0013. Though 1Inch is profitable, revenues are weak, and 1.2bn tokens degrades the price hugely. 1INCH is also an investment to avoid.
IDEX, CAKE and SUSHI all show downside. IDEX was to be expected following relative valuation. We expected PancakeSwap to have upside, perhaps to $5-11, however, DCF suggests $0.72. Relative valuation indicated SushiSwap was well valued and in the right price band. DCF recommends 89% downside to $0.08.
Why might this be? Taking the full analysis into account suggests that, though DEX tokens have been in a bear market for over two years, they remain hugely overvalued. Most tokens show fundamental value less than 80% of their market price. This has skewed the relative valuation of other tokens (CAKE, SUSHI) that are perhaps not as overvalued, since it indicates room upside. This highlights the importance of complementing relative with intrinsic valuation.
The bear market has reduced revenues and expenses over the last six quarters for all protocols, altering growth expectations. It is, therefore, tricky to estimate projections. We suggest it unreasonable to expect either to remain negative or low over the next 2 years, since an uptick in user numbers that may align with a bull run will see both increase. We use 14% for expenses, since we found this to be an optimal figure for lending protocols.
If revenues do continue a negative trend, all projects will struggle. Being technologically advanced, DeFi applications require substantial funding to expand their networks and support developers, liquidity providers and stakers. Expenses will increase. Businesses that fail to generate enough revenue to cover expenses will struggle.
The market is pricing DEXs at significant multiples of their fundamentals. We conclude that investors should refrain from the market at this time.
Metelski, D., & Sobieraj, J. (2022). Decentralized Finance (DeFi) Projects: A Study of Key Performance Indicators in Terms of DeFi Protocols’ Valuations. IJFS, 10 (4), 1-23.
Pandit, M. (2021). Valuing AAVE. Available at: Medium (Accessed: 13 July 2024).
Soni, U., & Preece, R. (2023). Valuation of Cryptoassets: A Guide for Investment Professionals. Available at: CFA Institute.
Todaro, J. (2018). Valuing Crypto Assets using a DCF Model. Available at: Medium (Accessed: 13 July 2024).
Xu, T. A., Xu, J., & Lommers, K. (2022). DeFi vs TradFi: Valuation Using Multiples and Discounted Cash Flows. Papers 2210.16846, arXiv.org.
Disclaimer: This analysis is for informational purposes only and does not constitute financial advice. Readers are encouraged to conduct their own research and seek professional advice before making investment decisions.


Leave a comment