Lending dApps in Decentralised Finance
A NOTE ON DECENTRALISED LENDING APPLICATIONS
Lending protocols allow users to lend and borrow cryptoassets, receiving interest or paying it. Smart contracts execute the transfer of assets when certain conditions are met, rather than a centralised third party. These protocols have made credit immediately accessible to anyone with a network wallet and created a way to collateralise real-world assets on-chain. Borrowers use tangible assets as collateral for DeFi loans; for example, an investor could bring their stock holdings on-chain and borrow against them, receiving a loan of stablecoins.
In asset selection, we must reason why an investor should prefer one project over another. We provide both fundamental and relative valuation for several leading dApps in the space. See calculation terminology here.

FINANCIAL DATA
| Platform | Native Token | Price | Circulating Supply | Market Cap |
|---|---|---|---|---|
| Aave | AAVE | $293.02 | 15,210,000 | $4,456,834,200 |
| Compound | COMP | $47.50 | 9,390,000 | $446,025,000 |
| Sky | SKY | $0.08 | 21,280,000,000 | $1,607,916,800 |
| Radiant Capital | RDNT | $0.02 | 1,290,000,000 | $28,444,500 |
| Venus | XVS | $6.17 | 16,260,000 | $100,324,200 |
Source: CoinMarketCap
Date: 16 August 2025
| Platform | Treasury | Annualised Fees | Annualised Revenues | Total Value Locked |
|---|---|---|---|---|
| Aave | $240,600,000 | $700,369,122 | $111,699,567 | $64,600,000,000 |
| Compound | $41,500,000 | $55,047,344 | $4,654,149 | $3,900,000,000 |
| Sky | $859,500,000 | $365,109,934 | $365,109,934 | $15,100,000,000 |
| Radiant Capital | $7,600,000 | $124,539 | $90,836 | $63,700,000 |
| Venus | $107,600,000 | $73,182,475 | $29,208,795 | $2,100,000,000 |
Source: Token Terminal
Date: 16 August 2025
| Platform | Market Cap to Net Assets | Price to Fees | Price to Sales | Market Cap to TVL |
|---|---|---|---|---|
| Aave | 18.5x | 6.4x | 39.9x | 0.11x |
| Compound | 10.7x | 8.1x | 95.8x | 0.11x |
| Sky | 1.9x | 4.4x | 4.4x | 0.11x |
| Radiant Capital | 3.7x | 228.4x | 313.1x | 0.45x |
| Venus | 1.4x | 1.4x | 3.4x | 0.05x |
Date: 16 August 2025
| Token | Revenue Q1-24 ($) | Revenue Q2-25 ($) | CQGR | Expenses Q1-23 ($) | Expenses Q2-24 ($) | CQGR |
|---|---|---|---|---|---|---|
| AAVE | 8,163,000 | 18,675,000 | 23% | 8,484,000 | 21,241,000 | 25.8% |
| COMP | 364,139 | 716,821 | 18.5% | 824,152 | 1,712,000 | 20.1% |
| SKY | 20,880,000 | 84,306,000 | 41.8% | 40,666,000 | 74,452,000 | 16.3% |
| RDNT | 323,494 | 12,035 | -56.1% | 1,054,000 | 150,346 | -38.5% |
| XVS | 1,150,000 | 8,347,000 | 64.1% | 1,390,000 | 225,279 | -36.6% |
Date: 16 August 2025
Relative Valuation
Aave
Aave is a decentralised non-custodial liquidity market protocol where users can participate as suppliers or borrowers. Suppliers provide liquidity to the market to earn passive income, while borrowers can borrow in an overcollateralised (perpetually) or undercollateralised (one-block liquidity) fashion. To interact, one must supply their preferred asset and amount, which is allocated to an open and audited smart contract. After supplying assets, users earn passive income based on borrowing demand and can also borrow by using their assets as collateral.
Aave’s native token, AAVE, is used to vote on proposals and for staking. Users pay fees when they borrow, deposit, liquidate an asset or use flash loans. The protocol splits fees between a Decentralised Autonomous Organisation (DAO) and those who stake AAVE. The specific fee level chosen for each asset is affected by an asset’s supply, market cap and market depth.
Aave has by far the largest market cap of lending protocols, despite having the fourth lowest circulating supply (15.21M). This is attributable to a high price of $293.02 per token. Alongside Venus (0.05), Aave has a very low market cap/TVL of 0.07, reflecting an enormous $64.6B locked on-chain. This quadruples that locked on Sky (second highest TVL) and indicates that users find significant utility in the protocol, since they are willing to deposit significant sums for the benefit of the platform.
Aave’s P/S ratio of 39.9 is high compared to Sky and Venus, suggesting overvaluation based on revenues. However, many protocols sacrifice revenues to reinvest back into the platform, so we also consider P/F. Aave’s, at 6.4x, is low, suggesting the protocol retains a sizeable proportion of fees to improve the platform. This benefits users in the long-term and may be linked to general willingess to deposit assets on chain. Noting that treasury assets may be used to fund roadmaps, we liken the market cap/net assets ratio to a price-to-book in TradFi, for which a ratio below 1.0 is considered healthy. Aave’s ratio is highest among lending protocols – 18.5 – and should be a red flag. However, behind this ratio are net assets of $241M; second highest among lending protocols. This should be considered a strength, since more funds are available for future projects. It instead indicates that Aave’s market cap is driven primarily by TVL.

We calculate the price of AAVE based on the ratios of competitors. The findings suggest:
- AAVE is overvalued relative to XVS.
- On P/F, AAVE is heavily undervalued relative to RDNT.
- AAVE is slightly undervalued compared to COMP.
AAVE would be overvalued if it had the fundamentals of Venus, which appears Aave’s closest competitor. Both are valued primarily on TVL: Venus has a TVL 3.25% the size of Aave’s and a price 2.11% of Aave’s. They are in similar supply and look well positioned to invest in protocol upgrades, with net assets between $107-240M. However, Aave pulls ahead in fees which, annualised at $700M, greatly exceeds all competitors. This makes AAVE appear overvalued, projecting a price of $63.12, since Venus has a far lower P/F ratio. But we consider fees a strength of Aave, which retains 84% to reinvest in the protocol, where Venus books 40% as revenue.
In general, however, Aave looks relatively well priced. Radiant multiples appear outliers, as we explore further, and may be disregarded.
Compound
Compound allows users to collateralise cryptoassets to borrow a base asset. Users earn interest by supplying the base asset to the protocol and deposited assets are held in smart contracts known as liquidity pools. Smart contracts automate interest rate calculation based on supply and demand. Lenders meet borrowers without third-party intervention.
Compound’s native token, COMP, allows community governance of the protocol. Holders debate, propose and vote on changes, so upgrades come from a diverse pool and users are incentivised to collectively steward the network with good governance. Users pay both a transaction fee and a miner fee when they mint, borrow, liquidate, transfer, repay or redeem a loan on Compound.
Initial observations place Compound in the top three for the cohort. It holds the third highest market cap, at $446M, with a price of $47.50 per token. TVL of $3.9B also places third, supporting a strong market cap/TVL ratio of 0.11. Studies have found TVL to correlate positively with protocol valuation. As with Aave, the substantial value locked on-chain indicates that users find significant utility in Compound and contribute funds in support.
However, Compound performs far worse than Aave in revenue and fee generation. Annualised fees of $55M and revenues of $4.7M equate to just 7.9% and 4.2% of Aave’s, respectively. Low revenues drive a P/S ratio of 95.8, substantially higher than every competitor but Radiant and indicative of heavy mispricing. That said, fees are likely baked into COMP’s valuation, noting a more conservative P/F ratio of 8.1. Fees are also found to be positively correlated with DeFi valuation, supporting Compound’s position in the middle of the pack, and it appears that Compound is reinvesting 92% of fees back into protocol improvements.
Treasury assets are used to fund future proposals. Compound’s market cap/net assets ratio of 10.7 is high but below Aave (18.5). High ratios across most protocols support the suggestion that TVL is the primary driver behind valuation.
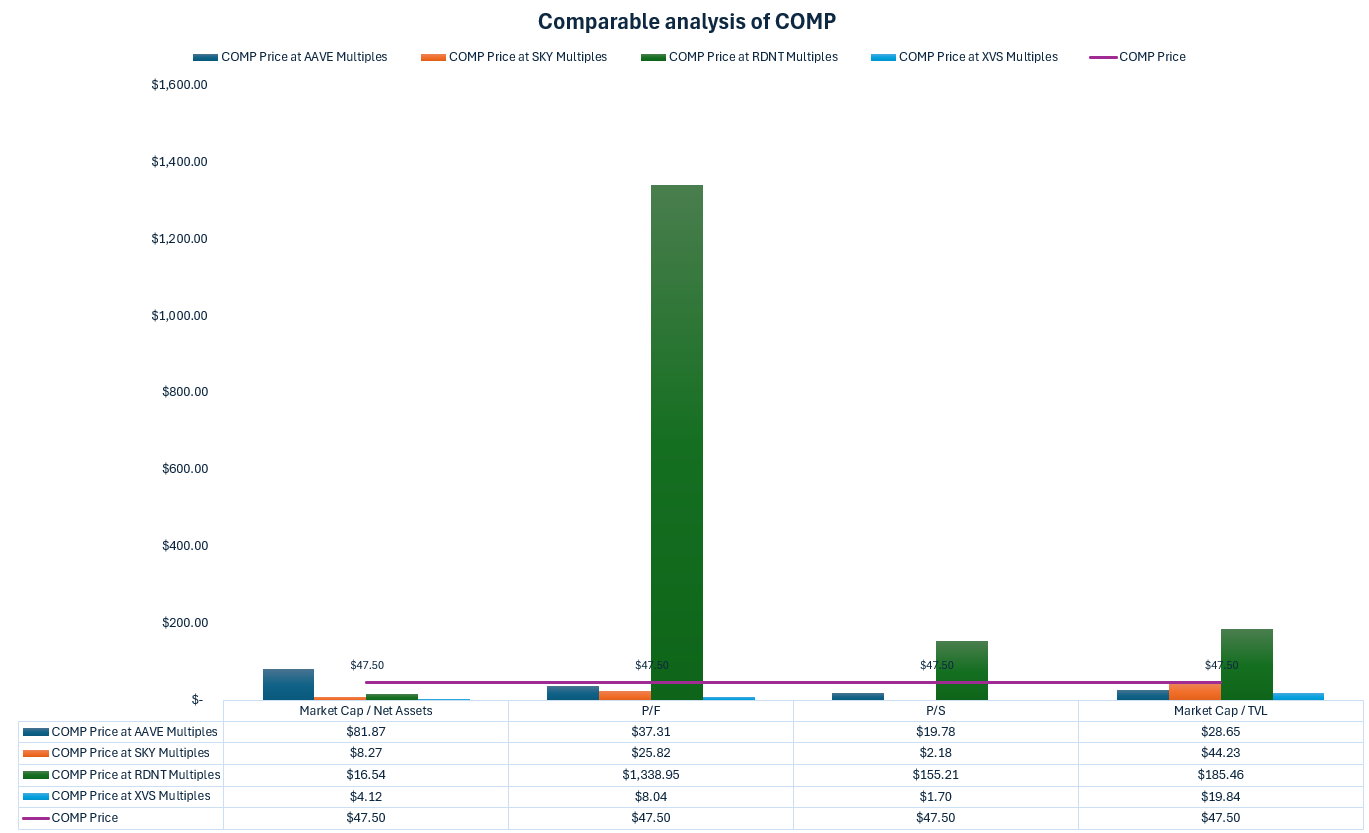
Comparable analysis of Compound suggests:
- COMP is overvalued relative to AAVE, SKY and XVS.
- COMP is undervalued relative to RDNT based on P/F, P/S and market cap/TVL.
The derived price of COMP exceeds market price at all AAVE, SKY and XVS multiples, aside from AAVE’s market cap/net assets, suggesting COMP is overvalued. Referencing the original data, Compound’s TVL is just 6% of Aave’s, yet its market cap 10% that of AAVE. In addition, Compound generates fewer fees and revenues than Venus, has a smaller treasury, yet its market cap is 3.44x greater. Note that Compound’s TVL only exceeds that of Venus by 85%.
We note relative undervaluation compared to RDNT. However, Radiant Capital performs poorest on all fundamentals and a more prudent view considers it overpriced, which diminishes the visibility of a misprice of Compound.
Overall, our analysis suggests Compound is overvalued. A more reasonable price places COMP at $8-28, or downside of 41-83%.
Sky
Sky is a decentralised financial infrastructure built around the USDS stablecoin and SKY governance token. It enables permissionless, non-custodial access to DeFi products and allows users to trade tokens, earn rewards and participate in governance without relinquishing control of their assets. Key features include Sky Token Rewards, the Sky Savings Rate (SSR) and a framework for decentralised governance. It was formerly known as Maker.
Intuitively, the more capital locked on a protocol, the greater the proclivity for developmental activity and subsequent benefit accrual to network users. Sky has a TVL of $15.1B, so we might predict a large market cap, and this is indeed the case at $1.61B. Sky’s price per token of $0.08 highlights the huge circulating supply of 21.28B; a far cry from the former Maker protocol which had under 1M circulating tokens at a price near $2,000.
Sky generates substantial fees but appears tp converts all $365M into revenues, calculating P/S and P/F ratios of 4.4. On the low side, these ratios look attractive among peers and affirms Sky’s position as a leading revenue generator in the space. A market cap/TVL ratio of 0.11 is healthy, being under 1.0, but is larger than Aave and Venus. Lastly, Sky has a low market cap/net assets ratio of 1.9. This suggests that Sky is reasonably priced based on its net assets.
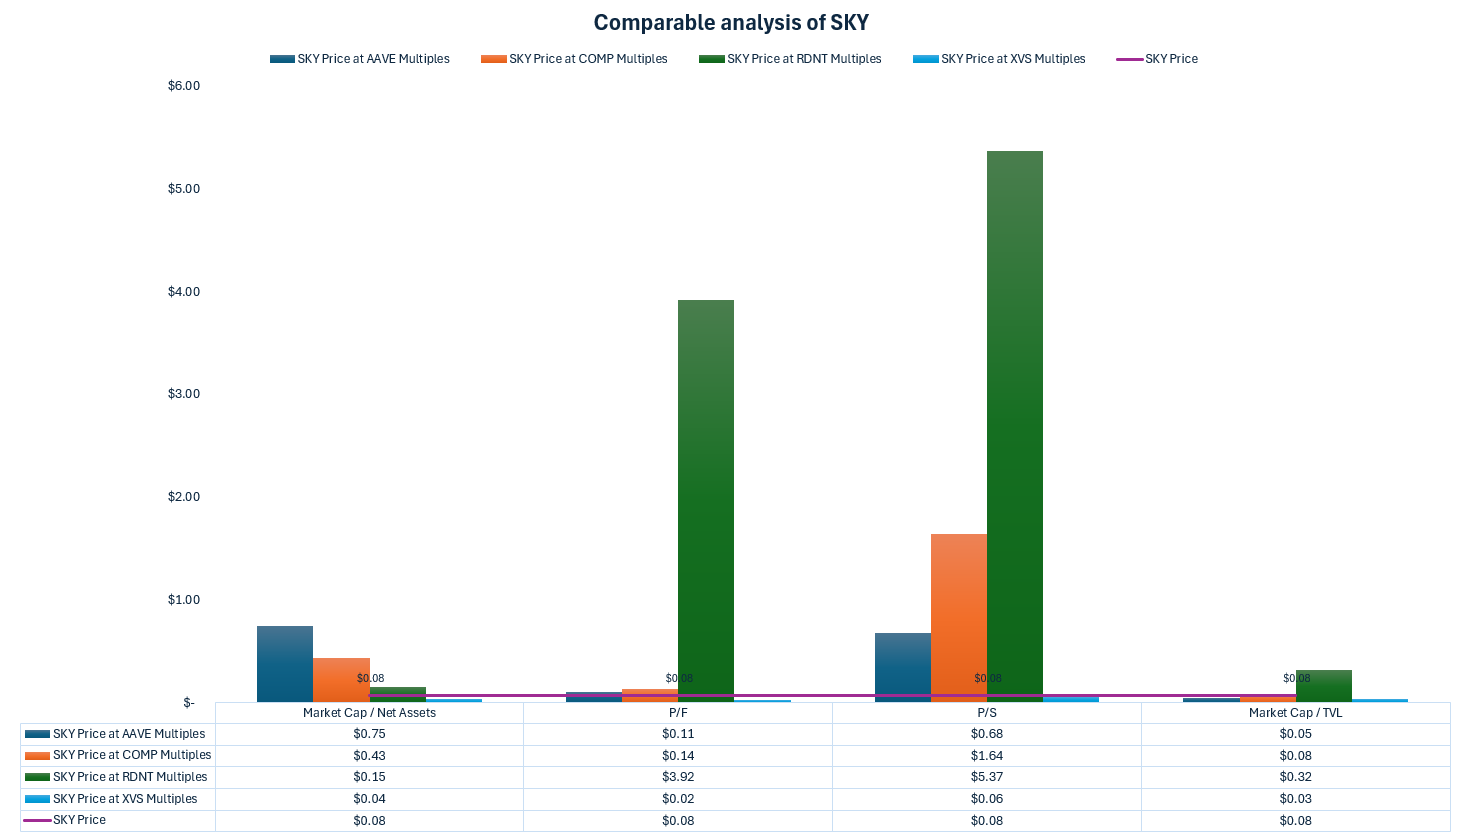
Comparable analysis presents the following findings:
- Sky performs very well and would be overvalued if it had the P/F or P/S multiple of most peers.
- Sky is undervalued based on multiples of RDNT.
- Sky looks well priced, given its TVL.
A clear strength of Sky is its revenues. We calculate a possible price of $2 using the P/S ratio of Compound – up 2400%. However, looked at another way, it may indicate that Sky is not reinvesting enough into the project. As we have seen, competitors bank a smaller percentage of their fees as revenues and this may give them an edge in the long-run. A relative lack of investment is a warning sign of possible long-term weakness.
Aave and Venus look most appropriate and deem Sky to be in the right ballpark. Market cap/TVL ratios both place SKY below $0.08, whilst P/F has SKY between $0.02-$0.11. This is a possible upside of 37.5% and downside of 75%. Our analysis of the cohort as a whole leads us to conclude that SKY is probably slightly overvalued and has a realistic downside of 37.5% to $0.05.
Radiant Capital
Radiant Capital aims to be the first omnichain money market into which users can deposit any major asset on any major chain and borrow assets across multiple chains. The DAO’s primary goal is to consolidate billions of dollars of fragmented liquidity dispersed across the top ten blockchain layers. Radiant has a native utility token, RDNT, which users can procure by interacting with and supporting the platform.
Total platform fees vary daily based on the amount of borrowing interest, liquidations and flash loan fees the protocol generates over a rolling 24-hour period. Daily fees are distributed linearly over seven days and split across liquidity provisioning (60%), lender base fees (25%) and allocated to the DAO-controlled operating expenses wallet (15%).
Immediately obvious is the low price of RDNT – $0.02. This can, in part, be explained by 1.29B circulating tokens, but Radiant’s market cap is also the weakest.
TVL goes some way to explaining this. $63.7M is just 3.03% of the TVL of Venus – next highest with $2.1B. Combined with fees of $124,539, of which $90,836 is booked as revenue, and we quickly see why Radiant’s P/F and market cap/TVL ratios are larger than its peers. The latter, under 1.0, is positive, but quadruples that of the nearest competitor.
Comparable analysis paints a mixed picture:
- RDNT is overpriced based on the ratios of all competitor P/S, P/F and market cap/TVL.
- RDNT is underpriced given market cap/net assets ratios of AAVE and COMP.
As highlighted previously, Aave and SKY both have market caps that look overvalued given their treasury. Radiant Capital’s looks more reasonable, which explains the undervaluation observed. However, both Aave and Sky have substantial TVL, which Radiant lacks. If we consider, based on published research, that the primary drivers behind a protocol’s value are TVL and fees, Aave and Sky’s valuations appear more reasonable. Radiant Capital looks heavily overvalued.
The highest price achieved is $0.06, with Compound’s net assets multiple. But using market cap/TVL ratios, RDNT should at best be valued at $0.01: 50% of its current price. Performance as a multiple for competitors brings us to the conclusion that Radiant Capital is the weakest of the group and overvalued. We suggest RDNT has a 90% downside to well under $0.01.

Venus
Venus is a lending platform and synthetic stablecoin protocol on the BNB Smart Chain. Users can lend or borrow from a pool of assets and interest rates are set by the protocol and automated based on demand. Suppliers of collateral can mint synthetic stablecoins (VAI) with overcollateralised positions. XVS is the native token of Venus and supports governance. By staking XVS, users gain voting power proportionate to the amount staked.
XVS has a price of $6.17, second lowest of the group, which aligns with the second lowest market capitalisation. This is, in part, attributable to the number of tokens in circulation – if the supply of XVS matched that of COMP, its price would jump to $10.68. Noting that Venus has a TVL of $2.1B – 54% of Compound’s – it is surprising that its price would be just 22% that of Compound’s if they had comparable supplies.
Yet, both fees and revenues exceed Compound, suggesting Venus not only has better potential to sustain itself long-term, but also currently allocates more funding to enhance platform features. Does the market agree? Venus has a P/F ratio of just 1.4, which could imply that investors do not have confidence in Venus’ long-term potential to sustain fees, or might indicate that investors have failed to price fees in. A P/S ratio of 3.4 supports the latter, as the belief that revenues will be sustained is priced into XVS.
Accordingly, Venus performs very well across the range of metrics. Market cap/TVL of 0.05 matches Aave as strongest in the cohort, so we might expect a higher market capitalisation based on TVL alone. Venus also holds the strongest market cap/net assets ratio at 0.9. In traditional finance, a ratio of 1.0 is considered healthy, so XVS looks most appropriately valued.
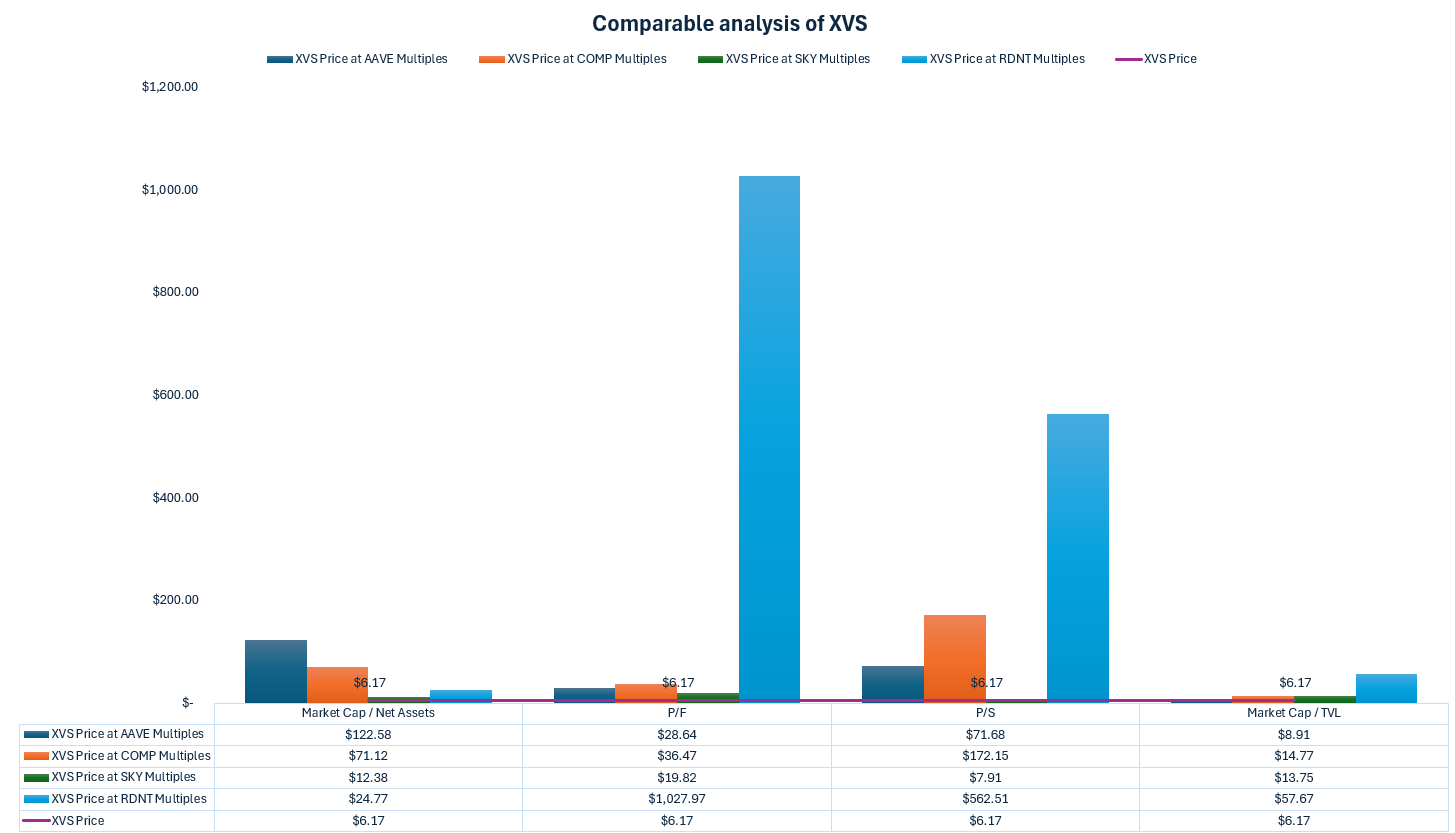
Previous comparisons using Venus’ multiples suggest XVS may be undervalued. Comparable analysis supports this:
- XVS is undervalued on all multiples.
Applying multiples of all other protocols would see Venus’ price skyrocket, in many cases above $12 and even as high as $71.68. From previous discussion, the most appropriate ratios for lending protocols appear to be P/F and market cap/TVL, both of which suggest XVS is undervalued. P/F derivations in particular support our theory that the market has not properly accounted for the fees Venus generates.
We conclude that XVS is undervalued at current market price. Based on the ratios of Aave and Sky, a more reasonable price might be in the region of $8.91-19.82, which could see an upside swing of 221%.
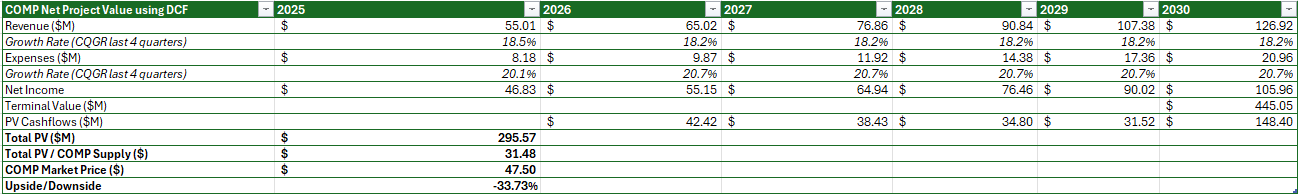
Intrinsic Valuation
We turn to intrinsic valuation with a discounted cash flow (DCF) model. Compound quarterly growth rate of revenues was calculated for each protocol across the last six quarters (Q3-24 to Q2-25). We then calculated the average of each CQGR and applied it to each protocol for a five-year period to forecast future earnings. The same methodology was applied on expenses. Additionally, DeFi tokens face higher risk, so we discount their value by a higher factor. In Series A funding rounds for venture capital, the generally accepted rate is 30–50% per annum. Several studies value cryptoassets using 25-40%. We use 30%, with a perpetual growth rate of 5%.
| Group Perpetual Growth Rate | 5% |
| Group Discount Rate | 30% |
| Group Average Compound Quarterly Growth Rate – Revenues | 18.2% |
| Group Average Compound Quarterly Growth Rate – Expenses | 20.7% |
Date: 16 August 2025
AAVE

Compound
Sky

Radiant Capital

Venus

Projections show lending tokens to be relatively hyped. Aave and Compound exhibit overvaluation with prices at least double their theoretical level. Compound has downside of 33.73% to $31.48: supporting our comparable analysis ($8-28). AAVE’s price converges on $262, a 10% drop. Sky, too, looks overvalued. 87.75% downside pulls it to $0.01: far below current level.
Lowered revenue projections hurt valuations more and increasing the discount rate to 40% (factoring more risk) reveals further downside: -39% for AAVE, -55% for COMP and -91% for SKY.
Radiant Capital is unviable, owing to consistent negative net income. A hugely negative CQGR over the last four quarters suggests 18.2% revenue growth year-on-year is generous; indeed, applying -56.1% projects downside of -114%. Of course, theoretically this is unfeasible, as Radiant should liquidate. To make it an investment of any value first requires Radiant to become profitable.
By contrast, VXS tokens show signs of undervaluation. Upside of 58% to $9.74 aligns with comparable analysis, which suggested $8.91-19.82, though reigns this projection in to the lower end. We can factor more risk by increasing the discount rate to test Venus’ fundamentals. 40% changes things slightly, finding upside of 8.25% to $6.68. A discount rate of 35% still offers 28.76% upside to $7.94.
In all, our analysis suggests that DeFi tokens are slightly overvalued compared to their theoretical prices. However, this is not uncommon. Revenues and TVL have grown as the broader market has matured (with Bitcoin reaching all time highs), so prices will naturally inflate. 18.2% seems a reasonable forecast of revenue growth for this cohort, though it cannot realistically apply to all (Radiant Capital, for example, has shown negative CQGR).
Being technologically advanced, DeFi applications require substantial funding, so expenses increase. Businesses that fail to generate enough revenues to cover expenses will struggle and this is highlighted by the fact that even high revenue forecasts cannot mask severe downside. All are risky – blockchain technology is still explorative and user numbers have yet to reach those of centralised businesses.
That said, there is value to be found. Venus may have good prospects, with a strong treasury and large TVL relative to its market cap. Users find utility in its service. Given the higher valuation placed on other lending protocols, Venus appears to fly under the radar.
Metelski, D., & Sobieraj, J. (2022). Decentralized Finance (DeFi) Projects: A Study of Key Performance Indicators in Terms of DeFi Protocols’ Valuations. IJFS, 10 (4), 1-23.
Pandit, M. (2021). Valuing AAVE. Available at: Medium (Accessed: 13 July 2024).
Soni, U., & Preece, R. (2023). Valuation of Cryptoassets: A Guide for Investment Professionals. Available at: CFA Institute.
Todaro, J. (2018). Valuing Crypto Assets using a DCF Model. Available at: Medium (Accessed: 13 July 2024).
Xu, T. A., Xu, J., & Lommers, K. (2022). DeFi vs TradFi: Valuation Using Multiples and Discounted Cash Flows. Papers 2210.16846, arXiv.org.
Disclaimer: This analysis is for informational purposes only and does not constitute financial advice. Readers are encouraged to conduct their own research and seek professional advice before making investment decisions.


Leave a comment